Charting a bull flag, S&P 500 maintains gap support as volatility recedes
Focus: Nasdaq Composite and Dow industrials also sustain rallies atop major support
U.S. stocks are slightly higher mid-day Friday, rising despite a consumer price report signaling inflation running at its hottest pace since 1982.
Against this backdrop, the S&P 500 is acting reasonably well technically, thus far sustaining its bullish reversal from the December low.
Editor’s Note: As always, updates can be directly accessed at chartingmarkets.substack.com.
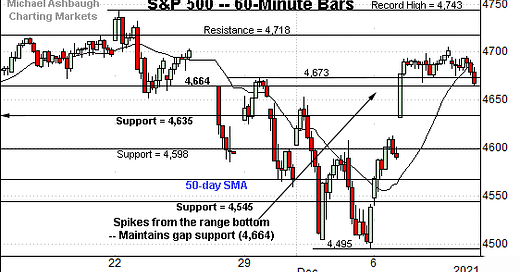
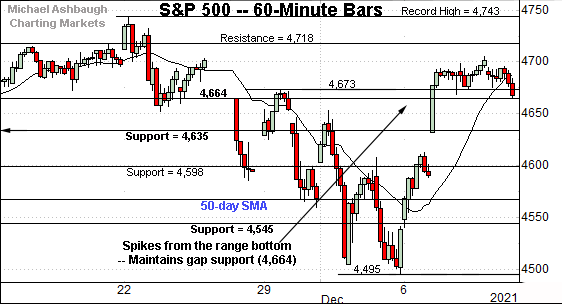
Before detailing the U.S. markets’ wider view, the S&P 500’s hourly chart highlights the past four weeks.
As illustrated, the S&P is digesting its bullish reversal. The prevailing pullback has been flat, underpinned by gap support (4,664).
Thursday’s session low (4,665.9) registered nearby.
Delving deeper, the S&P’s former breakdown point (4,635) closely matches the top of the December gap (4,632).
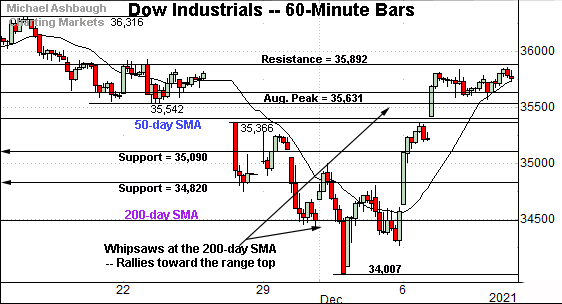
Similarly, the Dow Jones Industrial Average is consolidating a sharp rally from the December low.
Against this backdrop, the index has sustained a posture atop major support (35,630) an area better illustrated on the daily chart.
Delving deeper, the early-week gap (35,424) roughly matches the 50-day moving average, currently 35,409.
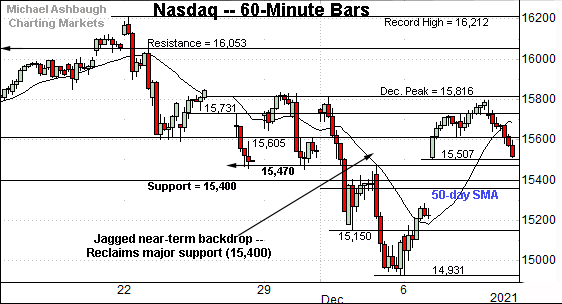
Meanwhile, the Nasdaq Composite has reversed less aggressively from the December low.
Its rally attempt has stalled under the early-December peak (15,816) unlike the other benchmarks.
Nonetheless, the Nasdaq has thus far sustained its rally atop major support — the 15,400 area — better illustrated below.
(On a granular note, the Nasdaq has also maintained gap support (15,507) detailed previously. Thursday’s session low (15,511) and Friday’s early low (15,510) registered nearby.)
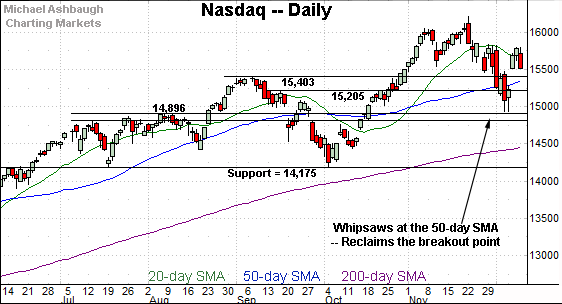
Widening the view to six months adds perspective.
On this wider view, the Nasdaq has sustained its bullish reversal atop the breakout point (15,403), a key bull-bear fulcrum, detailed repeatedly.
Delving slightly deeper, the 50-day moving average, currently 15,361, is rising toward major support.
Tactically, a sustained posture atop this area — the 15,360-to-15,400 area — signals a bullish intermediate-term bias.
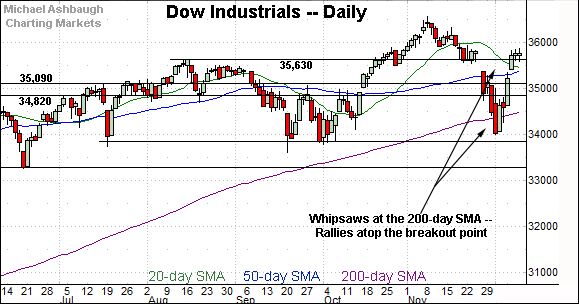
Looking elsewhere, the Dow Jones Industrial Average is digesting a bullish reversal from the 34,000 mark.
Against this backdrop, the index has registered three straight closes slightly atop its former breakout point (35,630).
Delving deeper, the 50-day moving average, currently 35,408, is followed by the former range top (35,090). Tactically, a sustained posture atop this area signals a bullish intermediate-term bias.
Slightly more broadly, recall the prevailing upturn punctuates a jagged test of the marquee 200-day moving average. (The Dow started December with a single close under the 200-day moving average, its first since July 2020.)
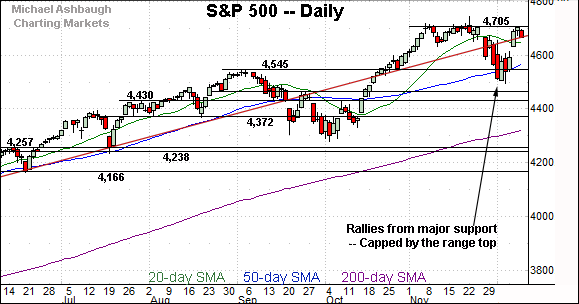
Meanwhile, the S&P 500 continues to outperform the other benchmarks.
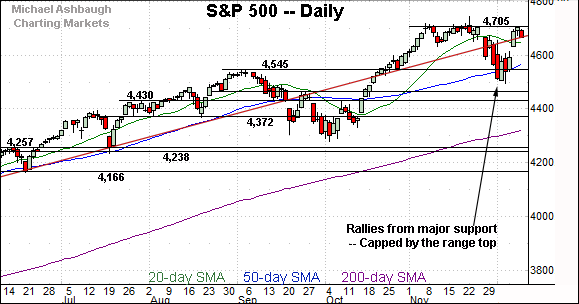
In fact, the index has challenged its record close (4,704.54) established Nov. 18.
The week-to-date peak (4,705.04) — also the December peak — has registered nearby.
Tactically, the pending selling pressure near the range top, or lack thereof, should be a useful bull-bear gauge.
The bigger picture
As detailed above, the major U.S. benchmarks seem to have weathered a jagged December start.
On a headline basis, each index has reversed sharply from the December low, sustaining a reversal back atop its breakout point — the Nasdaq 15,400, Dow 35,630 and S&P 4,545 areas.
And as it applies to the S&P 500, the index has at least briefly challenged its record close.
Combined, each benchmark’s prevailing backdrop continues to support a bullish intermediate-term bias.
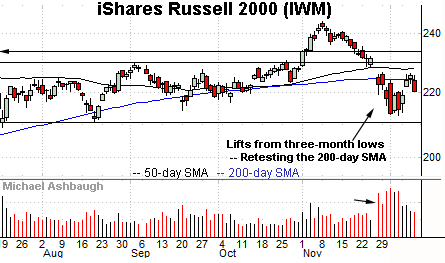
Moving to the small-caps, the iShares Russell 2000 ETF has registered less constructive price action.
Its initial violation of the 200-day moving average — fueled by a volume spike — has been punctuated by a comparably sluggish rally attempt.
Tactically, a sustained rally atop the 200-day moving average, currently 224.39, and the former range top (229.84) would neutralize the recent downdraft.
Meanwhile, the SPDR S&P MidCap 400 ETF remains comparably stronger than the Russell 2000.
Still, an extended retest of its former breakout point (506.00) remains underway.
The MDY’s backdrop supports a bullish intermediate-term bias to the extent this area is maintained.
Placing a finer point on the S&P 500, the index is acting relatively well.
As illustrated, its sharp rally from the December low has been punctuated by a tight range — or bull flag — underpinned by gap support (4,664).
Notably, gap support (4,664) is defined by the Nov. 26 session high, the day the omicron variant surfaced.
Put differently, the S&P has reversed to “status quo” territory, preceding the virus-fueled downdraft, and subsequent unexpectedly hawkish policy tilt to start December. Constructive price action.
Separately, the prevailing flag pattern punctuates decreased market volatility.
More broadly, the S&P 500’s bigger-picture inflection points remain relatively straightforward.
To start, the top of the December gap (4,632) closely matches the S&P’s former breakdown point (4,635).
Delving deeper, the 50-day moving average, currently 4,573, is followed by the breakout point (4,545), a familiar bull-bear fulcrum.
Broadly speaking, the prevailing backdrop supports a bullish intermediate-term bias barring a sustained violation of these areas. The response to the Federal Reserve’s next policy directive, due out next week, will likely add color.

