Charting a bullish reversal, S&P 500 narrowly holds 50-day average
Focus: 10-year Treasury yield presses the range top amid inflation surge, Apple narrowly holds 200-day moving average, TNX, AAPL, EOG, CME, SCCO
Technically speaking, the major U.S. benchmarks are off to a less-than-stellar start to May and the worst six-month seasonal period.
On a headline basis, the Nasdaq Composite has asserted bearish intermediate-term bias, pressured amid a damaging early-week downdraft. Meanwhile, the S&P 500 remains comparably resilient, thus far narrowly maintaining its 50-day moving average.
Editor’s Note: As always, updates can be directly accessed at chartingmarkets.substack.com. Your smartphone can also access updates at the same address, chartingmarkets.substack.com.
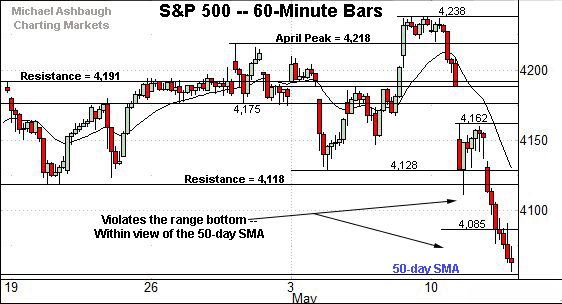
Before detailing the U.S. markets’ wider view, the S&P 500’s hourly chart highlights the past four weeks.
As illustrated, the S&P has violated its range bottom, extending within view of the 50-day moving average, currently 4,056.
Wednesday’s session low (4,056.9) registered just above the 50-day.
More immediately, the breakdown point (4,118) pivots to notable resistance. A retest is already underway early Thursday.
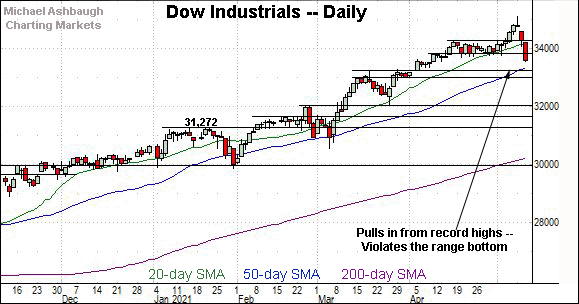
Meanwhile, the Dow Jones Industrial Average has swiftly plunged from Monday’s record high to one-month lows.
Tactically, the index has reversed to its former range with Thursday’s strong start.
Recall the former range top (34,160) is followed by the April peak (34,256).
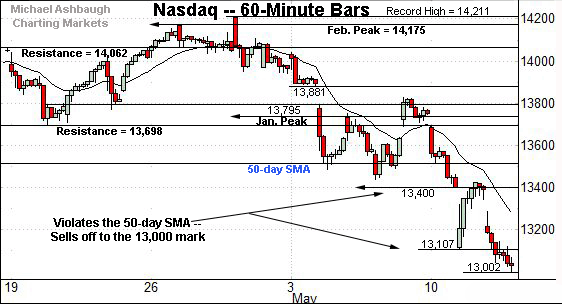
Against this backdrop, the Nasdaq Composite remains the weakest major benchmark.
As illustrated, the index has extended its violation of the 50-day moving average, tagging its latest six-week low (13,002).
The downturn places major support — the 2020 peak (12,973), illustrated below — firmly within view.
Widening the view to six months adds perspective.
On this wider view, the Nasdaq has extended an aggressive May downdraft amid a still bearish intermediate-term backdrop.
Tactically, the week-to-date low (13,002) has registered near the 2020 peak (12,973) an area that narrowly held amid the late-March downturn.
Conversely, initial resistance (13,208) is followed by the 50-day moving average, currently 13,527.
On further strength, the March peak (13,620) is followed by major resistance spanning from about 13,730 to 13,752. A reversal atop these areas would place the Nasdaq on firmer technical ground.
More broadly, market bears will point to a developing double top defined by the February and April peaks. A violation of the March low would resolve the pattern.
Looking elsewhere, the Dow Jones Industrial Average has knifed straight through its former range amid a swift two-day downdraft.
Tactically, the breakdown point (33,800) is followed by the former range top (34,160) and the April peak (34,256).
Conversely, the ascending 50-day moving average, currently 13,374, is followed by gap support (13,222). An eventual violation would raise an intermediate-term caution flag.
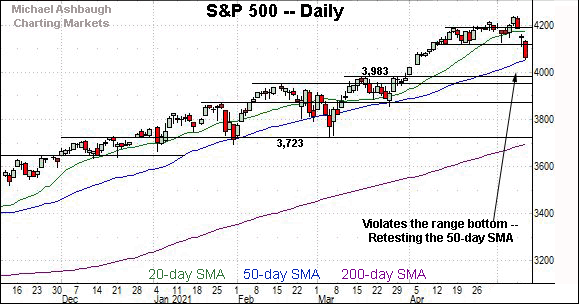
Similarly, the S&P 500 has violated its range bottom (4,118).
The downturn has thus far been punctuated by a successful test of the 50-day moving average, currently 4,056. As always, the 50-day is a widely-tracked intermediate-term trending indicator.
The bigger picture
Collectively, the major U.S. benchmarks are off to a less-than-stellar start to May and the worst six-month seasonal period.
Still, a familiar market divergence remains in play.
On a headline basis, the Nasdaq Composite’s intermediate-term bias remains bearish. The index has knifed firmly under its 50-day moving average amid a damaging downturn.
Meanwhile, the prevailing backdrops of the S&P 500 and Dow industrials continue to signal a bullish intermediate-term bias.
In many respects, the S&P 500’s prevailing price action mirrors the sharp late-August breakout, and subsequently aggressive early-September downturn. A choppy two-month consolidation phase ensued, punctuated by the steep November breakout.
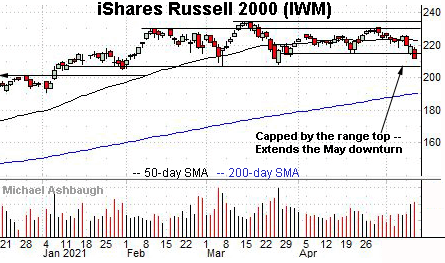
Moving to the small-caps, the iShares Russell 2000 ETF remains range-bound.
Still, the prevailing strong-volume downturn places the benchmark at six-week lows.
Tactically, the April range bottom (215.24) pivots to resistance.
Conversely, the three-month range bottom (207.21) marks a deeper floor.
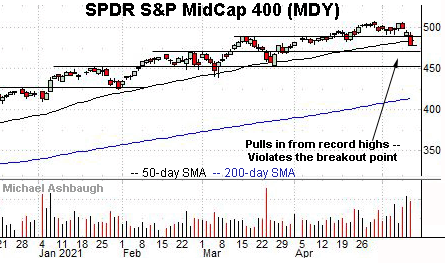
Meanwhile, the SPDR S&P MidCap 400 remains comparably stronger.
Nonetheless, the MDY has violated its breakout point (489.50) and the 50-day moving average, currently 484.45, pressured amid increased volume.
(Thursday’s early session high (489.44) has matched resistance amid a retest from underneath.)
Placing a finer point on the S&P 500, the index has narrowly maintained its 50-day moving average, currently 4,056.
To reiterate, Wednesday’s session low (4,056.9) registered nearby, and the S&P is firmly higher early Thursday.
Tactically, the breakdown point (4,118) is closely followed by the early-May low (4,128).
More broadly, the S&P 500 has knifed through a less-charted patch — a potential air pocket — detailed previously.
Amid the downturn, the S&P 500’s intermediate-term bias remains bullish, based on today’s backdrop.
Still, the prevailing downdraft has been punctuated by respectable selling pressure, on the order of the strongest in two months. (Wednesday’s NYSE negative breadth pressed a 5-to-1 reading, approaching, but not reaching, the 7-to-1 threshold sufficient to raise a caution flag.)
Tactically, deeper gap support — at 4,034 and 4,020 — is followed by the the S&P’s April breakout point (3,983).
As always, it’s not just what the benchmarks do, it’s also how they do it. But generally speaking, the S&P 500’s intermediate-term bias remains bullish barring a violation of the 3,980 area.
Editor’s Note: The next review will be published Monday.
The Watch List
Drilling down further, consider the following sectors and individual names:
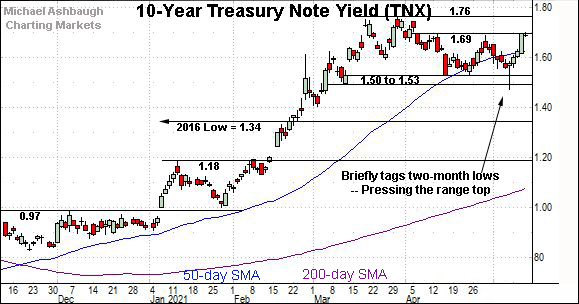
To start, the 10-year Treasury yield has turned higher, rising amid this week’s tandem consumer and producer price reports, signaling surging inflation.
The upturn places the range top (1.69) under siege, an area closely followed by the yield’s 15-month high (1.76).
On further strength, an overhead target projects to the 1.94 area, and is followed by the 2017 low (2.03).
Slightly more broadly, the yield’s prevailing two-month range is a bullish continuation pattern — detailed previously — hinged to the massive first-quarter spike. Recall the yield nearly doubled across just three months from the January low (0.91) to the March peak (1.76).
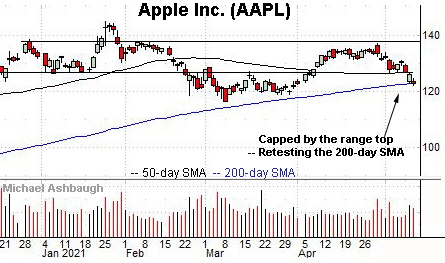
Moving to specific names, Dow 30 component Apple, Inc. has reached a headline technical test.
Specifically, the shares are pressing the marquee 200-day moving average, currently 123.12.
Wednesday’s close (122.77) registered fractionally under the 200-day — for the first time in 13 months — though the retest technically remains underway.
Tactically, a sustained violation would raise a caution flag. Deeper floors match the former range bottom (118.85) and the March low (116.20).
Conversely, overhead inflection points match the October peak (125.40) and the 50-day moving average, currently 126.90. A swift reversal atop this area would place the shares on firmer technical ground.
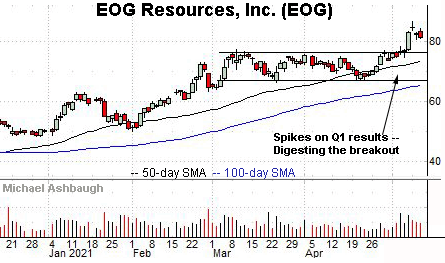
EOG Resources, Inc. is a well positioned large-cap oil and gas name. (Yield = 2.0%.)
Earlier this month, the shares knifed to 52-week highs, rising after the company’s strong quarterly results. The breakout punctuated an orderly two-month range.
By comparison, the ensuing pullback has been flat, fueled by decreased volume, placing the shares 6.4% under the May peak.
Tactically, the post-breakout low (80.48) is followed by the firmer breakout point, circa 76.50. A sustained posture higher signals a firmly-bullish bias.
Southern Copper Corp. is a large-cap copper producer coming to life, rising in sympathy with recent industrial commodity strength. (Yield = 3.4%.)
Technically, the shares have rallied to the range top, rising to challenge record highs.
The prevailing strong-volume spike punctuates an inverse head-and-shoulders pattern defined by the March and April lows.
Tactically, the pattern’s neckline (78.20) is closely followed by gap support (77.00). A breakout attempt is in play barring a violation.
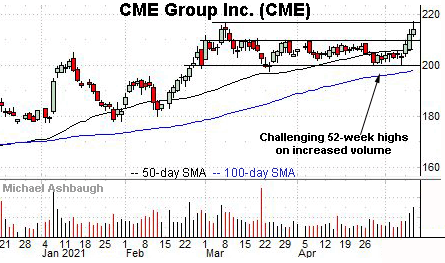
Finally, CME Group, Inc. — formerly known as the Chicago Mercantile Exchange — is a well positioned large-cap name. (Yield = 1.7%.)
As illustrated, the shares are challenging 52-week highs, rising amid recently broadly-based commodity strength.
The prevailing upturn punctuates a tight two-month range — and has been fueled by increased volume — laying the groundwork for potentially material follow-through.
Tactically, a breakout attempt is in play barring a violation of the former range top (209.40).
Editor’s Note: The next review will be published Monday.


