S&P 500 fails major test, pressured amid 7-to-1 down day
Focus: Nasdaq Composite and S&P 500 draw aggressive selling pressure near key levels
Technically speaking, the major U.S. benchmarks have extended an April downdraft, tagging one-month lows amid aggressive selling pressure.
Moreover, the prevailing downturn originates from major resistance — near S&P 4,495 and Nasdaq 13,680 — incrementally strengthening the bigger-picture bear case.
Editor’s Note: As always, updates can be directly accessed at https://chartingmarkets.substack.com.
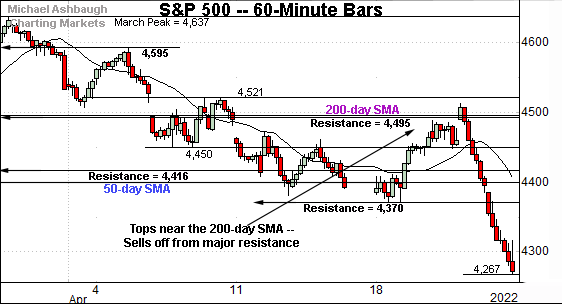
Before detailing the U.S. markets’ wider view, the S&P 500’s hourly chart highlights the past four weeks.
As illustrated, the S&P has failed a headline technical test.
Specifically, the index has drawn selling pressure near major resistance (4,495) matching the 200-day moving average, currently 4,496.
The subsequent 5.4% downdraft, across just two sessions, places the S&P at one-month lows.
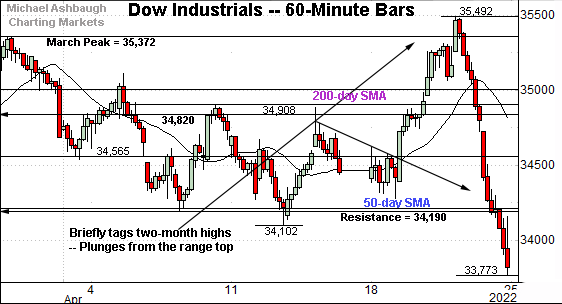
Meanwhile, the Dow Jones Industrial Average has reversed sharply from its range top, plunging as much as 1,719 points, or 4.8%, across just two sessions.
The downturn places the index back under its 50- and 200-day moving averages.
Tactically, the breakdown point (34,190) pivots to resistance.
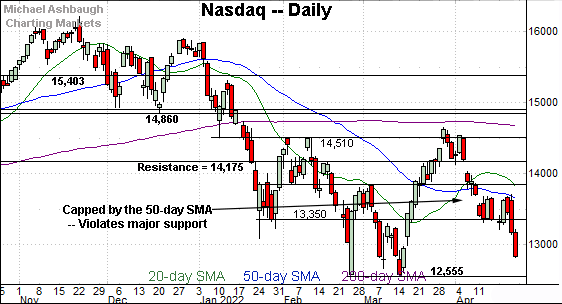
Against this backdrop, the Nasdaq Composite remains the weakest major benchmark, plunging as much as 882 points, or 6.4%, across just two sessions.
The prevailing downturn originates from major resistance (13,682), an area detailed repeatedly.
Combined, the S&P 500 and Nasdaq Composite have reversed sharply from bull-bear inflection points — S&P 4,495 and Nasdaq 13,680.
Widening the view to six months adds perspective.
On this wider view, the Nasdaq has extended its downturn, placing distance under the 50-day moving average.
Tactically, the downturn likely opens the path to an eventual test of the March low (12,555). (Nearby inflection points match the February low (12,587) and March closing low (12,581).)
Conversely, the breakdown point (13,350) pivots to resistance.
Beyond specific levels, the Nasdaq’s bigger-picture backdrop remains bearish.
Looking elsewhere, the Dow Jones Industrial Average has whipsawed near the 200-day moving average, tagging two-month highs, and one-month lows, across just two sessions.
Tactically, potential support rests in the 33,435 and 33,130 areas. Delving deeper, the March closing low (32,632) is followed by the year-to-date low (32,272).
More broadly, the prevailing downturn punctuates yet another “lower high” at the April closing peak.
Meanwhile, the S&P 500 has extended its April downturn.
The prevailing pullback originates from major resistance (4,495) matching the 200-day moving average, currently 4,496.
This area marks a familiar bull-bear inflection point, detailed repeatedly.
The bigger picture
As detailed above, a prounced two-day downdraft has incrementally damaged an already-bearish backdrop.
Though due a corrective bounce, the U.S. benchmarks’ bigger-picture trends point lower, pending repairs.
Moving to the small-caps, the iShares Russell 2000 ETF has also tagged one-month lows.
The prevailing downturn has been fueled by slightly increased volume, placing the shares under the 50-day moving average and trendline support.
Delving deeper, the 187.90-to-188.10 area marks a notable floor, levels closely matching the January and February lows.
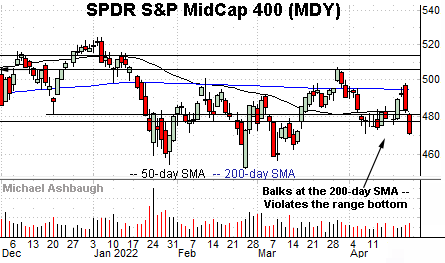
Meanwhile, the SPDR S&P MidCap 400 ETF has staged a bearish reversal near the 200-day moving average, selling off to one-month lows.
Tactically, the 477 area pivots to resistance. The pending retest from underneath will likely add color.
Returning to the S&P 500, this next chart is a weekly view, spanning 30 months. Each bar on the chart represents one week.
As illustrated, the S&P is traversing a lower plateau, capped by major resistance (4,545) detailed repeatedly. (See for instance, the Feb. 18 review.)
Consecutive weekly closes matched resistance, and the S&P has subsequently turned lower. (See the March 25 close (4,543) and April 1 close (4,545) near the turn of the first quarter.)
The prevailing downturn punctuates a developing head-and-shoulders top, defined by the September, January and March peaks.
More broadly, from the 2020 pandemic-induced low (2,192) to the record high (4,818), established Jan. 4, 2022, the S&P 500 rallied 119.8% across about 22 months.
Last week’s close (4,272) placed the index 11.3% under the record high.
(Separately, the pre-pandemic peak (3,393) marks an arguably more useful reference point. The S&P’s record high (4,818) registered 42.0% above this level.)
Returning to the six-month view, the S&P 500 has plunged 5.4% across just two sessions.
The pullback originates from major resistance (4,495) a key bull-bear inflection point, detailed repeatedly.
Perhaps as notably, the downturn has been fueled by aggressive selling pressure, approaching bearish extremes.
For instance, the NYSE has registered a 5-to-1 down day, and a 7-to-1 down day, across consecutive sessions. (In this context, a down day means declining volume surpassed advancing volume by a 7-to-1 margin.)
As always, in a textbook world, two 9-to-1 down days — across about a seven-session window — reliably signals a major trend shift. (The 2019 rally originated from two 9-to-1 up days across a precisely seven-session window.)
So while not textbook bearish, the two-session downdraft marks unusually aggressive selling pressure in the post-pandemic market context.
Tactically, the January low (4,222) is followed by major support (4,170), the level from which the massive March rally originated.
Conversely, the 4,280 and 4,370 areas mark overhead inflection points. The pending retest from underneath should be a useful bull-bear gauge.
Beyond specific levels, it’s not just what the S&P 500 does, as always, it’s how it does it. By this measure, the prevailing downturn incrementally strengthens the bear case.
Though a corrective bounce is due — following an aggressive two-session plunge — the S&P 500’s bigger-picture trends point lower, pending repairs.


