Charting market cross currents, S&P 500 maintains trendline support
Focus: Dow industrials reclaim 200-day average even as Nasdaq Composite challenges its breakdown point (10,565)
Technically speaking, the major U.S. benchmarks continue to diverge amid a market seeking value, largely at the expense of growth.
Against this backdrop, the Dow Jones Industrial Average has strengthened in recent weeks — amid a safe-haven trade — as the Nasdaq Composite continues to underperform. The charts below add color:
Editor’s Note: As always, updates can be directly accessed at https://chartingmarkets.substack.com.
Before detailing the U.S. markets’ wider view, the S&P 500’s hourly chart highlights the past four weeks.
As illustrated, the S&P has reached a higher plateau.
Tactically, the 3,790-to-3,810 area — detailed previously — pivots to support.
The 50-day moving average (3,792) currently matches lower band.
True to recent form, the Dow Jones Industrial Average remains incrementally stronger.
In fact, the index has tagged two-month highs.
Tactically, the 200-day moving average, currently 32,548, remains an inflection point, an area also detailed on the daily chart.
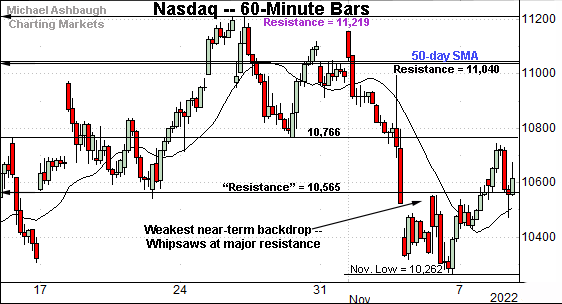
Against this backdrop, the Nasdaq Composite remains the weakest major benchmark.
Tactically, the index has whipsawed at major resistance (10,565) — detailed repeatedly — an area also illustrated on the daily chart below.
Wednesday’s early session high (10,564.97) has matched resistance.
Widening the view to six months adds perspective.
On this wider view, the Nasdaq is not acting well technically.
As illustrated, the index is hugging its its former breakdown point (10,565) — detailed repeatedly — amid a sluggish upturn from the November low.
Slightly more broadly, the prior rally attempt has been capped by major resistance (11,220), an area established after the Federal Reserve’s September policy statement. (Also see the hourly chart.)
Looking elsewhere, the Dow Jones Industrial Average remains strikingly stronger than the Nasdaq Composite.
Technically, the index has tagged two-month highs, reclaiming its marquee 200-day moving average, currently 32,548, a widely-tracked longer-term trending indicator.
But recall the Dow has not registered more than four consecutive closes atop the 200-day moving average since February, the hallmark of a primary downtrend.
This makes the next several sessions worth tracking as a bull-bear gauge. A sustained rally atop the 200-day moving average would strengthen the bull case.
Slightly more broadly, the Dow’s massive October trendline breakout marked an unusually strong two standard deviation rally. The subsequent sideways chop has been punctuated by upside follow-through. Constructive price action.
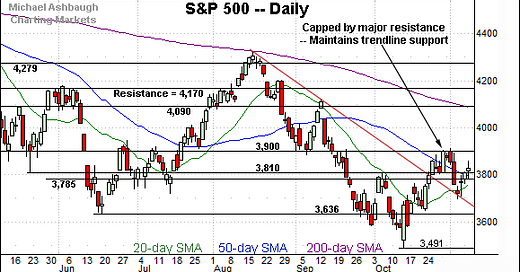
Meanwhile, the S&P 500 has sustained a less aggressive trendline breakout.
Consider that trendline support has underpinned the November downturn.
Also recall the prior rally attempt stalled at major resistance (3,900), an area matching the June gap (3,900) and the May closing low (3,900).
The bigger picture
As detailed above, the major U.S. benchmarks remain in divergence mode amid a backdrop that is not one-size-fits all.
On a headline basis, the Dow Jones Industrial Average has strengthened in recent weeks, as it vies to sustain a break atop its 200-day moving average.
Conversely, the Nasdaq Composite continues to underperform amid a comparably sluggish November rally attempt. (If it can even be called a rally attempt.)
Meanwhile, the S&P 500’s backdrop splits the difference, as the index has not strayed too far from its 50-day moving average.
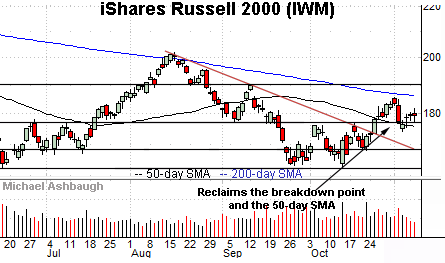
Moving to the small-caps, the iShares Russell 2000 ETF (IWM) is digesting a recent trendline breakout.
Amid the pullback, the small-cap benchmark has thus far maintained its former breakout point (177.50), detailed previously. Consecutive session lows have registered within a fraction.
Similarly, the SPDR S&P MidCap 400 ETF (MDY) has sustained a recent trendline breakout.
Recall trendline support closely tracks the 50-day moving average.
More broadly, the small- and mid-caps have sustained breaks from a double bottom — the W formation — defined by the September and October lows.
Returning to the S&P 500, the index seems to have sustained its late-year rally attempt.
Against this backdrop, the November downturn has been underpinned by trendline support to punctuate a respectable downturn from major resistance (3,900). The net result is a bull-bear stalemate amid a whipsaw near the 50-day moving average.
More immediately, the 3,785-to-3,810 area remains a bull-bear inflection point. (See the second-quarter close (3,785), the September Fed-induced level (3,790), the 50-day moving average, currently 3,792, and the May low (3,810).)
Delving deeper, the 20-day moving average, currently 3,768, is followed by the November low (3,698).
Tactically, a swift reversal back under the 3,785 support would raise a caution flag. Downside follow-through under the November low (3,698) would more firmly wreck the prevailing rally attempt.
Beyond near-term issues, the S&P 500’s more important bigger-picture backdrop remains bearish pending extensive repairs. No new setups today.
Editor’s Note: The next review will be published Tuesday, Nov. 15.


