Charting a bull-flag breakout attempt, S&P 500 challenges record close
Focus: U.S. dollar takes flight amid currency cross currents, Japanese yen tags multi-year lows, UUP, FXY, AMAT, DASH, LCID, FCX
Broadly speaking, the major U.S. benchmarks are acting well technically as a mid-month consolidation phase remains underway.
Against this backdrop, the S&P 500 and Nasdaq Composite have asserted higher plateaus, rising within striking distance of their respective record closes.
Editor’s Note: As always, updates can be directly accessed at chartingmarkets.substack.com.
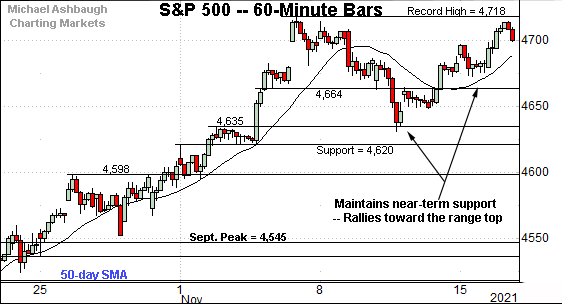
Before detailing the U.S. markets’ wider view, the S&P 500’s hourly chart highlights the past four weeks.
As illustrated, the S&P is holding its range top.
Consider that Tuesday’s close (4,700.9) narrowly missed the S&P’s record close (4,701.7) established Nov. 8.
The absolute record peak (4,718.5) remains slightly more distant.
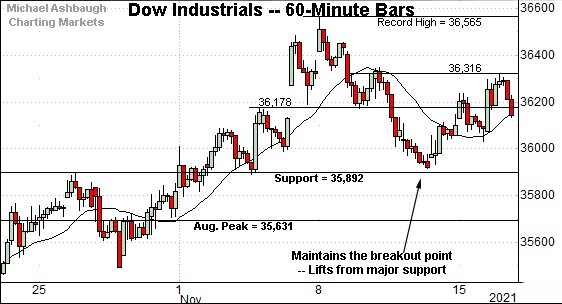
Meanwhile, the Dow Jones Industrial Average is digesting its early-November breakout.
Tactically, recall the recent pullback has been underpinned by the Dow’s breakout point (35,892).
Last week’s low (35,915) registered slightly above major support. Bullish price action.
Against this backdrop, the Nasdaq Composite has rallied toward its range top.
Here again, Tuesday’s close (15,974) registered narrowly under the Nasdaq’s record close (15,982) established Nov. 8.
Tactically, the 15,900 area is followed by near-term support (15,768).
Widening the view to six months adds perspective.
On this wider view, the Nasdaq has absorbed last week’s pullback from record highs.
Tactically, the post-breakout low (15,543) is followed by the firmer breakout point — the 15,384-to-15,403 area.
Conversely, an intermediate-term target continues to project to the 16,550 area.
(Note the Nasdaq has yet to close atop the 16,000 mark.)
Looking elsewhere, the Dow Jones Industrial Average continues to digest its recent rally to record territory.
The downturn has been underpinned by the 20-day moving average, currently 35,966, a bull-bear inflection point going back as far as August.
Delving deeper, the November peak (36,892) is followed by the firmer breakout point (35,630).
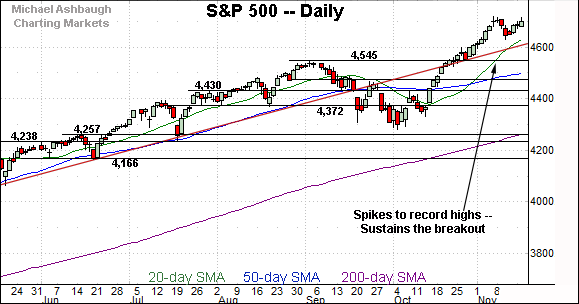
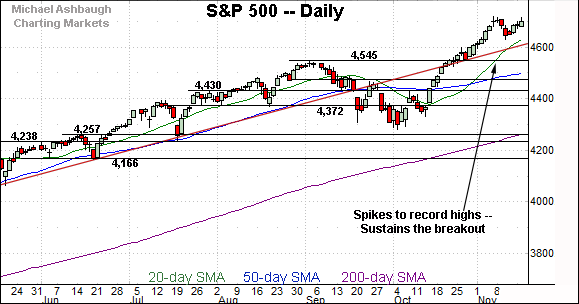
Meanwhile, the S&P 500 is approaching its range top.
The prevailing bull flag — the tight mid-November range, hinged to the previously steep rally — is a bullish continuation pattern.
The bigger picture
As detailed above, the major U.S. benchmarks are acting well technically.
Though a consolidation phase remains underway, recent selling pressure has inflicted limited damage amid a still firmly-bullish bigger-picture backdrop.
Moving to the small-caps, the iShares Russell 2000 ETF has also sustained its breakout.
As detailed repeatedly, its early-November spike marked a statistically unusual two standard deviation breakout, encompassing six straight closes atop the 20-day volatility bands.
Tactically, the post-breakout low (236.31) is followed by the firmer breakout point (234.50).
Placing a finer point on the S&P 500, the index has rallied toward its range top.
To reiterate, Tuesday’s close (4,700.9) registered fractionally under the S&P’s record close (4,701.7) established Nov. 8.
(Wednesday’s early session high (4,701.50) has effectively matched the record close.)
The S&P’s absolute record peak (4,718.50) remains slightly more distant.
More broadly, the S&P 500 has asserted a flag pattern hinged to its aggressive 3.4% technical breakout.
Against this backdrop, the prevailing inflection points remain relatively straightforward.
Tactically, the post-breakout low (4,630) is followed by trendline support, circa 4,610.
Delving deeper, the S&P’s breakout point (4,545) marks a more important floor. Broadly speaking, the S&P 500’s backdrop supports a bullish intermediate-term bias barring a violation of these areas.
Watch List
Drilling down further, the U.S. dollar has taken flight, rising as a recent batch of strong economic data has increased the prospects of a hawkish Federal Reserve policy tilt. (Hawkish policy translates to higher interest rates.)
Generally speaking, rising interest rates make the native currency (in this case the U.S. dollar) more attractive versus competing currencies, sending it higher.
Technically, the Invesco U.S. Dollar Index Bullish Fund has knifed to 16-month highs, rising amid increased volume.
More broadly, the shares have cleared the 200-week moving average — detailed on the two-year chart — punctuating a double bottom defined by the 2020 and 2021 lows.
Conversely, the Invesco CurrencyShares Japanese Yen ETF has tagged three-year lows.
The downturn has registered as the Bank of Japan maintains a comparably dovish policy stance versus other major central banks.
Technically, the prevailing downturn punctuates a one-month range, a yen-bearish continuation pattern. The breakdown point (82.10) pivots to resistance.
Elsewhere, the euro has also turned firmly lower, tagging 17-month lows amid the U.S. dollar’s surge.
Moving to specific names, Applied Materials, Inc. is acting well technically ahead of its quarterly results, due out Thursday.
Earlier this month, the shares knifed to record highs, rising from a well-defined six-month range.
The subsequent flag-like pattern signals still muted selling pressure, laying the groundwork for potential follow-through on the early-month spike.
Tactically, the post-breakout low (150.27) is followed by the breakout point (144.10). A sustained posture higher signals a bullish bias.
Initially profiled Nov. 3, Lucid Group, Inc. has returned 51.9% across just two weeks.
As illustrated, the shares have knifed to eight-month highs, rising after the company’s quarterly results, and the announcement that MotorTrend has named Lucid Air its car of the year.
Though near-term extended, and due to consolidate, the sharp November rally is longer-term bullish. Tactically, the breakout point, circa 47.50, is followed by deeper gap support (46.50).
Public since December 2020, DoorDash, Inc. is a well positioned large-cap name.
Late last week, the shares knifed to record highs, rising after the company’s third-quarter results.
The subsequent pullback places the shares 9.6% under the November peak.
Tactically, the breakout point — the 225.40-to-227.40 area — pivots to support. A sustained posture higher signals a bullish bias.
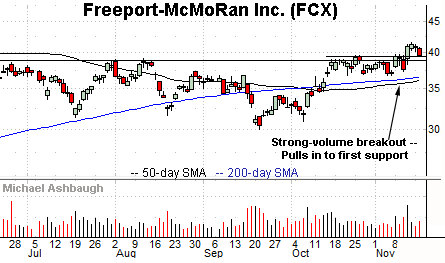
Finally, Freeport-McMoRan, Inc. is a large-cap copper and gold producer.
As illustrated, the shares have recently staged a strong-volume breakout, tagging five-month highs. The upturn punctuates a tight one-month range, underpinned by the 50- and 200-day moving averages.
More immediately, the prevailing pullback places the shares 5.1% under the November peak.
Tactically, the rally attempt is intact barring a violation of support spanning from about 38.70 to 39.40.


