Charting a headline technical test: S&P 500 challenges 50-day average
Focus: Crude-oil prices press 18-month highs, Microsoft's breakout attempt, USO, MSFT, F, PLTR, SBLK
U.S. stocks are lower early Friday, pressured after a soft consumer sentiment report and amid customary quadruple witching volatility.
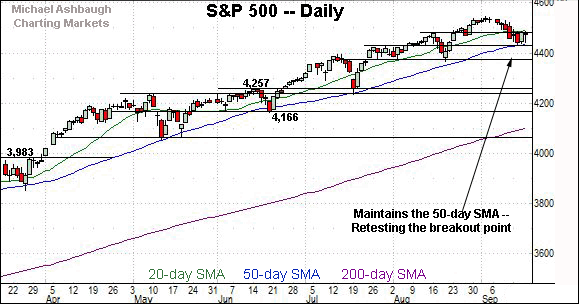
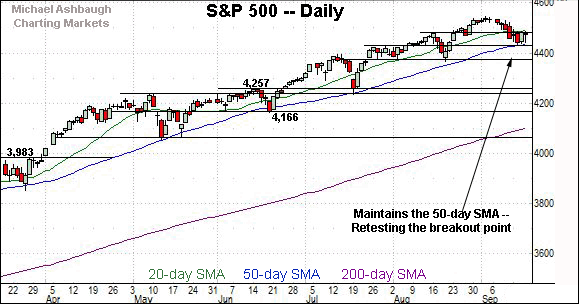
Against this backdrop, the S&P 500 has pulled in to its latest retest of the 50-day moving average, currently 4,436, a level that has generally underpinned the prevailing bull trend.
Friday’s early session low (4,435) has effectively matched the 50-day moving average, and the weekly close will likely add color.
Editor’s Note: As always, updates can be directly accessed at chartingmarkets.substack.com.
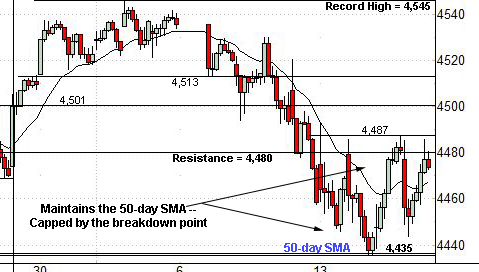
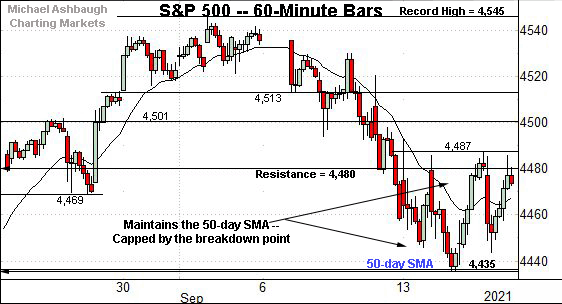
Before detailing the U.S. markets’ wider view, the S&P 500’s hourly chart highlights the past four weeks.
As illustrated, the S&P remains capped by its breakdown point (4,480).
The week-to-date closing peak (4,480.7) has matched resistance.
Conversely, the S&P has initially maintained its 50-day moving average, currently 4,436, a level closely matching the September low (4,435), established Tuesday.
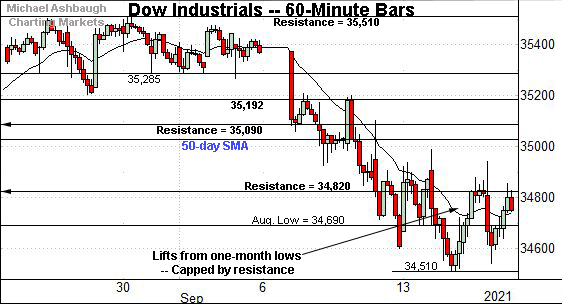
Similarly, the Dow Jones Industrial Average is digesting its September downturn.
Here again, recent rally attempts have registered as relatively flat, and capped by familiar resistance (34,820). (Also see the daily chart.)
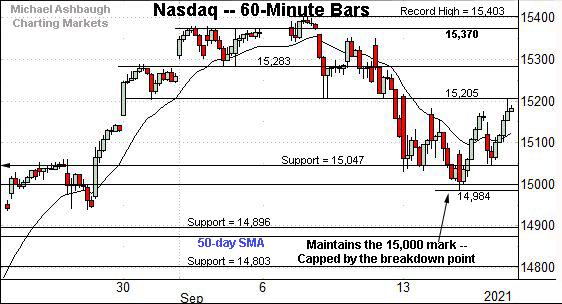
Meanwhile, the Nasdaq Composite has not yet registered one-month lows.
Still, the index remains capped by its mid-month breakdown point (15,205).
Tactically, near-term support (15,047) is followed by an inflection point around the 15,000 mark.
Widening the view to six months adds perspective.
On this wider view, the Nasdaq continues to digest its aggressive August breakout.
Against this backdrop, the 50-day moving average, currently 14,875, is rising toward the breakout point (14,896).
As detailed repeatedly, a sustained posture atop this area signals a bullish intermediate-term bias.
Looking elsewhere, the Dow Jones Industrial Average remains the weakest major benchmark.
As illustrated, the index has tagged nearly two-month lows — its worst level since July 19 — while also sustaining a posture under the 50-day moving average.
More immediately, the Dow remains capped by familiar resistance (34,820).
The post-breakdown closing peak (34,814) has registered nearby.
Beyond technical levels, the Dow’s intermediate-term bias remains bearish, based on today’s backdrop. An eventual rally atop resistance broadly spanning from about 34,820 to 35,050 would place the brakes on bearish momentum. (The latter matches the 50-day moving average, currently 35,047.)
Meanwhile, the S&P 500 is traversing a lower plateau.
Tactically, the breakdown point (4,480) has thus far capped the S&P’s sluggish rally attempt.
Conversely, the 50-day moving average, currently 4,436, is closely followed by the 4,430 support.
The bigger picture
As detailed above, the major U.S. benchmarks have diverged amid a backdrop that is not one-size-fits-all.
On a headline basis, the Nasdaq Composite continues to outperform, thus far maintaining a posture comfortably atop its breakout point (14,896).
Meanwhile, the S&P 500 has asserted a lower plateau — capped by the breakdown point (4,480) — and underpinned by the 50-day moving average.
Scaling down in strength incrementally, the Dow Jones Industrial Average has asserted a bearish intermediate-term bias. The blue-chip benchmark remains capped by resistance (34,820) and has asserted a posture under the 50-day moving average.
Moving to the small-caps, the iShares Russell 2000 ETF remains range-bound.
Tactically, the 50-day moving average (221.30) and 200-day moving average (218.65) remain nearby inflection points.
Similarly, the SPDR S&P MidCap 400 ETF remains range bound.
In its case, the 50-day moving average, currently 492.14, continues to more or less bisect the prevailing range.
Placing a finer point on the S&P 500, the index is digesting its September downturn.
In the process, the S&P has asserted a posture under its breakdown point (4,480), detailed repeatedly.
The week-to-date closing peak (4,480.7) has matched resistance.
Conversely, the 50-day moving average, currently 4,436, closely matches the September low (4,435).
More broadly, the S&P 500 has registered a nearly one-month low, its worst level since Aug. 20.
Tactically, the 50-day moving average, currently 4,436, is closely followed by the former range top (4,430).
The September low (4,435), established Tuesday, has registered nearby. (Friday’s early session low (4,435) has also matched the 50-day moving average and the September low.)
Against this backdrop, recall that prior bullish reversals have registered near one-month lows closely matching major support and the 50-day moving average. See the June, July and August lows — around 4,166, 4,257 and most recently 4,372.
To the extent this pattern holds, the 4,430 area remains a candidate for an intermediate-term market low.
Delving deeper, likely last-ditch support matches the former range bottom (4,372) and the August low (4,367). As detailed repeatedly, an eventual violation of the 4,370 area would mark a material “lower low” raising a technical caution flag.
The S&P 500’s intermediate-term uptrend gets the benefit of the doubt barring such a move.
Watch List
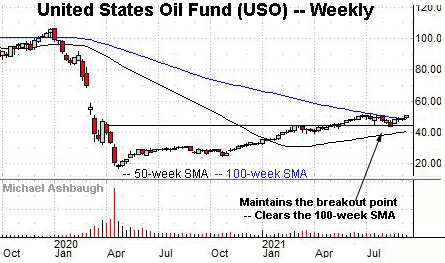
Drilling down further, the United States Oil Fund has staged a September rally. The fund tracks the spot price of light, sweet crude oil.
In the process, the shares are challenging 18-month highs, the best levels since March 2020.
More broadly, the shares have reclaimed the 100-week moving average, currently 49.74, a recent overhead sticking point. (See the weekly chart.) The USO is vying Friday to register consecutive weekly closes higher for the first time since December 2019.
Tactically, this week’s upturn signals a bullish shift to the intermediate-term bias. An eventual break from the range top (51.40) opens the path to a less-charted patch, punctuated by the massive 2020 gap.
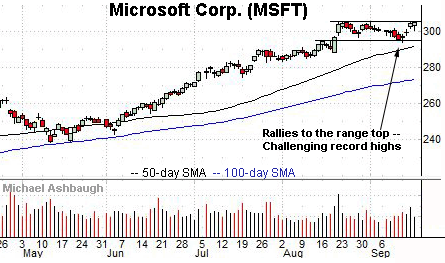
Microsoft Corp. is a well positioned Dow 30 component.
The shares initially spiked four weeks ago, knifing to record highs amid a volume spike.
More immediately, the shares have rallied to the range top, challenging record territory amid a down market. Tactically, a near-term target projects to the 312 area on follow-through.
Conversely, the 50-day moving average is rising toward the prevailing range bottom (294.10). A sustained posture higher signals a bullish bias.
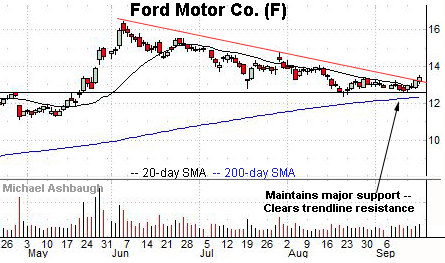
Ford Motor Co. is a large-cap name coming to life.
As illustrated, the shares have cleared trendline resistance, rising after the company announced it is increasing F-150 Lightning production capacity due to strong demand for the electric pickup truck.
Tactically, trendline support is followed by the 20-day moving average, a recent bull-bear inflection point. The prevailing rally attempt is intact barring a violation.
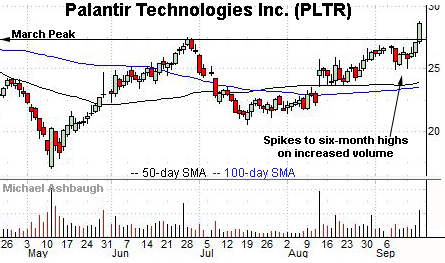
Public since September 2020, Palantir Technologies, Inc. is a large-cap developer of software solutions for intelligence applications.
Technically, the shares have knifed to six-month highs amid increased volume. The prevailing upturn punctuates a head-and-shoulders bottom defined by the March, May and July lows.
Though near-term extended, and due to consolidate, the strong-volume spike is longer-term bullish. Tactically, the breakout point (27.50) pivots to well-defined support.
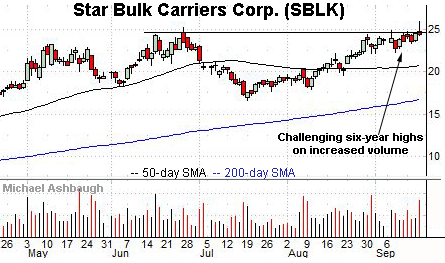
Finally, Star Bulk Carriers Corp. is a mid-cap Greece-based dry bulk shipping name.
As illustrated, the shares are challenging six-year highs.
The prevailing upturn punctuates a relatively tight September range — and has been fueled by increased volume — laying the groundwork for potentially decisive follow-through.
Tactically, the breakout attempt is intact barring a violation of near-term support, circa 22.75.

