Charting modest follow-through, S&P 500 approaches record territory
Focus: Brazil's breakout, Nvidia's breakout attempt, EWZ, NVDA, PANW, KO, MPC
U.S. stocks are mixed early Tuesday, vacillating after a solid batch of economic data.
Against this backdrop, the S&P 500 has rallied within striking distance of its record high (4,238). The pending retest to start June will likely add color.
Editor’s Note: As always, updates can be directly accessed at chartingmarkets.substack.com.
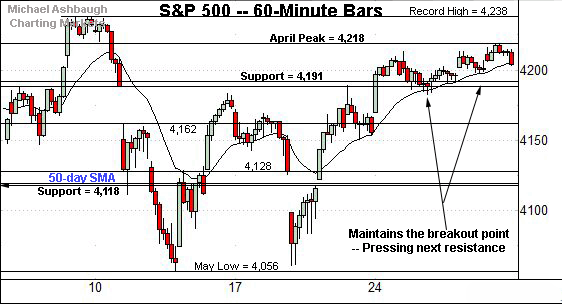
Before detailing the U.S. markets’ wider view, the S&P 500’s hourly chart highlights the past four weeks.
As illustrated, the S&P has sustained its break from a double bottom, the W formation defined by the May lows.
Tactically, the April peak (4,218) is followed by the S&P’s record close (4,232.60) and absolute record peak (4,238.04).
Conversely, familiar support holds in the 4,188-to-4,191 area.
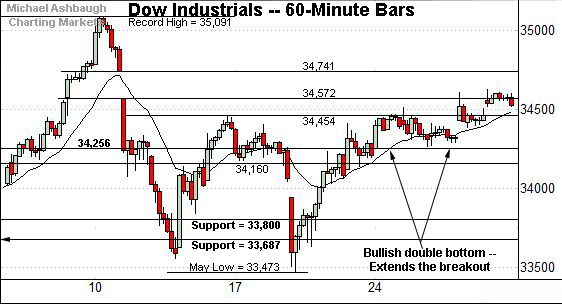
Meanwhile, the Dow Jones Industrial Average has also broken out.
Here again, the prevailing upturn punctuates a double bottom defined by the May lows.
On further strength, gap resistance (34,741) is closely followed by the Dow’s record close (34,777.76). The absolute record peak (35,091.56) remains slightly more distant.
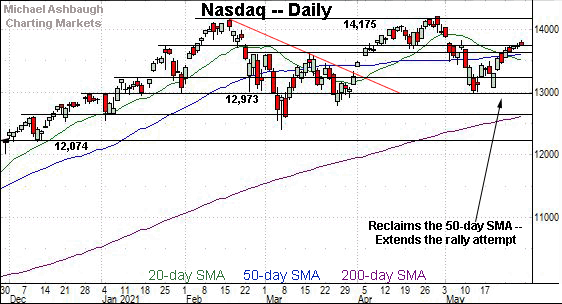
Against this backdrop, the Nasdaq Composite has also extended its rally attempt.
Recent follow-through punctuates a successful test of the March peak (13,620), an intermediate-term bull-bear inflection point detailed repeatedly.
Conversely, the Nasdaq’s one-month range top (13,828) remains an overhead inflection point.
Widening the view to six months adds perspective.
On this wider view, the Nasdaq has extended a grinding-higher rally atop the 50-day moving average and the March peak (13,620).
The prevailing upturn originates from a nearly 8-to-1 up day on the Nasdaq’s initial rally from the 13,000 mark.
Tactically, a sustained posture atop the 50-day moving average, currently 13,621 — (matching the March peak) — signals a bullish-leaning intermediate-term bias.
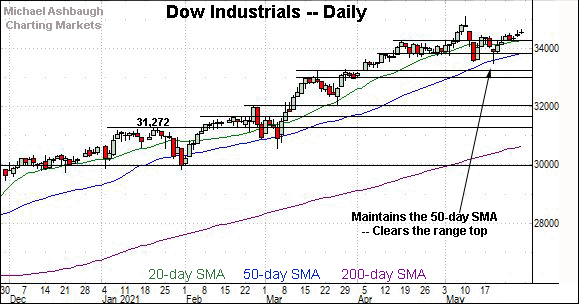
Looking elsewhere, the Dow industrials’ backdrop remains comparably straightforward.
Technically, the index has extended a grinding-higher rally from the 50-day moving average.
In the process, the blue-chip benchmark has reached a less-charted patch, capped by its record highs established last month. Recall the April peak (34,256) marks an inflection point, also detailed on the hourly chart.
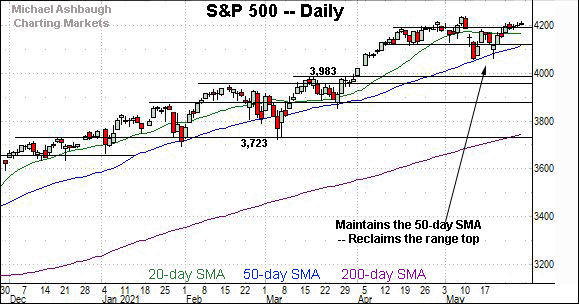
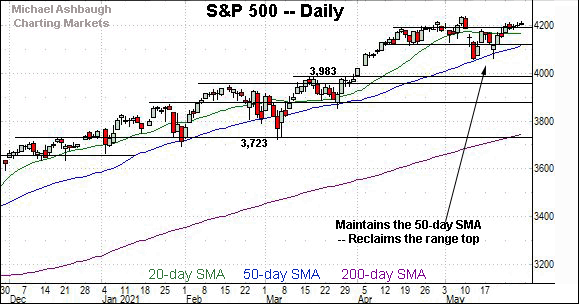
Meanwhile, the S&P 500 is digesting a recent rally from its 50-day moving average, currently 4,121.
The prevailing upturn places record territory within striking distance.
The bigger picture
As detailed above, the major U.S. benchmarks are starting June amid a still bullish bigger-picture backdrop.
Consider that each index concluded May with a successful test of major support — S&P 4,191, Dow 34,256 and Nasdaq 13,620 — followed by modest upside follow-through. Constructive price action.
Moving to the small-caps, the iShares Russell 2000 ETF remains range-bound.
Tactically, notable overhead spans from 230.30 to 230.95, levels matching the February and April peaks.
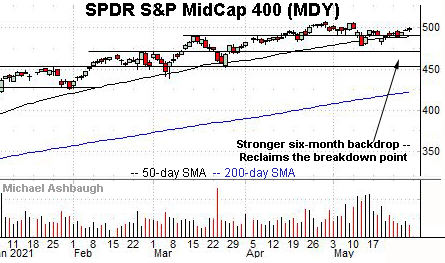
True to recent form, the SPDR S&P MidCap 400 remains comparably stronger, sustaining a modest rally atop its breakdown point (489.50).
Placing a finer point on the S&P 500, the index has sustained its break from a double bottom — the W formation — defined by the May lows.
Tactically, familiar support holds in the 4,188-to-4,191 area.
Conversely, last week’s high (4,218.36) effectively matched the April peak (4,218.78).
Returning to the six-month view, the S&P 500’s grinding higher follow-through punctuates a May volatility spike, and consecutive tests of the 50-day moving average.
On further strength, the S&P’s record close (4,232.60) and absolute record peak (4,238.04) are increasingly within view.
More broadly, a near- to intermediate-term target projects from the S&P’s mini double bottom to the 4,310 area, detailed previously.
Beyond specific levels, all trends continue to technically point higher as it applies to the S&P 500. The pending retest of record highs from underneath will likely add color.
Watch List
Drilling down further, consider the following sectors and individual names:
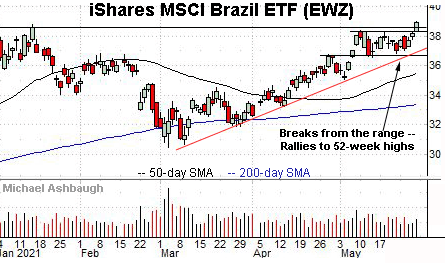
To start, the iShares MSCI Brazil ETF is acting well technically. (Yield = 1.8%.)
As illustrated, the shares have cleared the range top, edging to 52-week highs. The upturn punctuates a tight one-month range.
Tactically, the breakout point (38.35) is followed by trendline support and the deeper range bottom (36.55). The prevailing uptrend is intact barring a violation.
More broadly, the shares are well positioned on the five-year chart, placing distance atop the 200-week moving average.
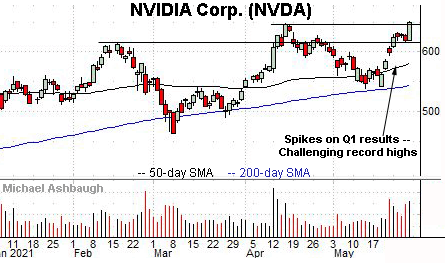
Nvidia Corp. is a well positioned large-cap semiconductor name.
Technically, the shares have rallied to tag a nominal record high, rising after the company’s first-quarter results.
The strong-volume upturn punctuates a tight one-week range, laying the groundwork for potentially more decisive follow-through. Tactically, a sustained posture atop near-term support (618.40) signals a firmly-bullish bias.
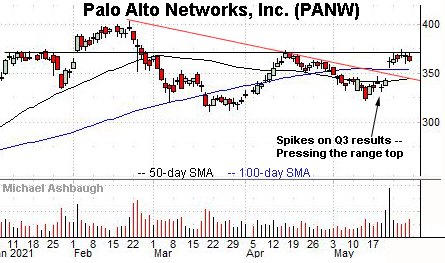
Palo Alto Networks, Inc, is a large-cap cybersecurity name coming to life.
Late last month, the shares gapped atop trendline resistance, rising after the company’s quarterly results. The subsequent “pullback” has been flat — fueled by decreased volume — positioning the shares to build on the initial spike.
Tactically, gap support (356.10) closely matches the 100-day moving average, currently 354.35.
More broadly, the prevailing upturn punctuates a developing double bottom defined by the March and May lows.
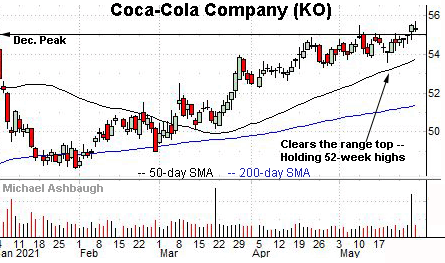
Coca-Cola Co. is a well positioned Dow 30 component. (Yield = 3.0%.)
As illustrated, the shares have sustained a strong-volume break to 52-week highs.
Tactically, the breakout point (55.00) is followed by near-term support, circa 53.80. The 50-day moving average, currently 53.84, matches the latter.
More broadly, the shares are well positioned on the five-year chart, extending a recent break from pandemic-zone territory.
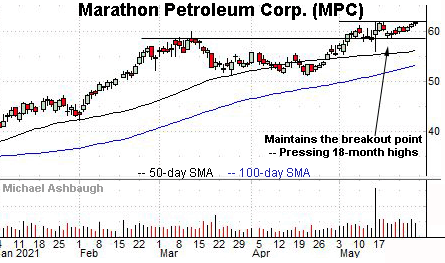
Finally, Marathon Petroleum Corp. is a well positioned large-cap name. (Yield = 3.8%.)
Technically, the shares are challenging 18-month highs.
The prevailing upturn punctuates a tight May range, laying the groundwork for potentially decisive follow-through. A near-term target projects to the 65 area.
Tactically, a breakout attempt is in play barring a violation of the prevailing range bottom (58.80).


