Nasdaq vies for record close ahead of the Fed
Focus: Brazil sustains technical breakout, General Electric maintains key support, EWZ, LLY, GE, FUBO, APPN
U.S. stocks are mixed early Monday, vacillating ahead of the Federal Reserve’s policy statement, due out Wednesday.
Against this backdrop, the Nasdaq Composite has rallied within striking distance of its record close (14,138.77) while the S&P 500 treads water amid rotational price action.
Editor’s Note: As always, updates can be directly accessed at chartingmarkets.substack.com.
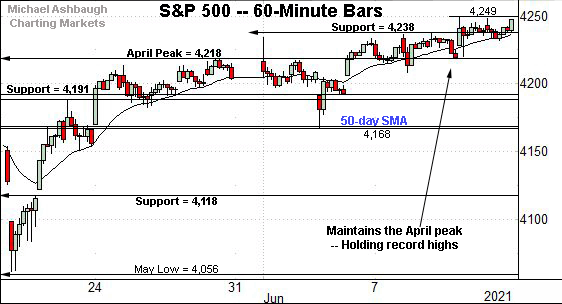
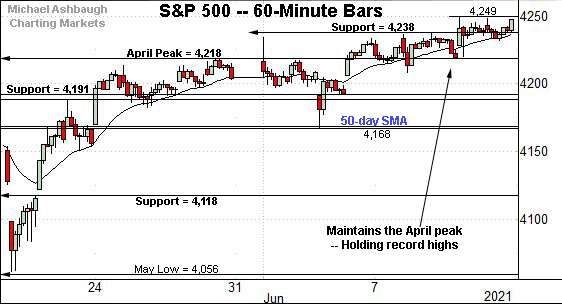
Before detailing the U.S. markets’ wider view, the S&P 500’s hourly chart highlights the past four weeks.
As illustrated, the S&P is holding record territory.
The index concluded last week with a record close (4,247.44) in grinding-higher form.
Tactically, initial support (4,238) is followed by a firmer floor matching the April peak (4,218).
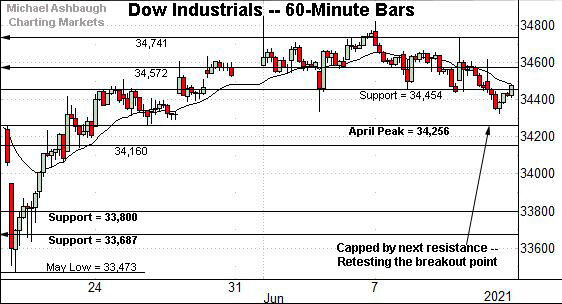
Meanwhile, the Dow Jones Industrial Average remains range-bound.
Tactically, the Dow’s breakout point (34,454) is followed by an inflection point matching the April peak (34,256).
Slightly more broadly, the prevailing pullback originates from Thursday’s session high (34,738) closely matching gap resistance (34,741).
Against this backdrop, the Nasdaq Composite has extended its June breakout.
As illustrated, the 20-hour moving average has underpinned recent follow-through, signaling a persistent near-term trend.
Delving deeper, the prevailing upturn originates from the breakout point (13,828).
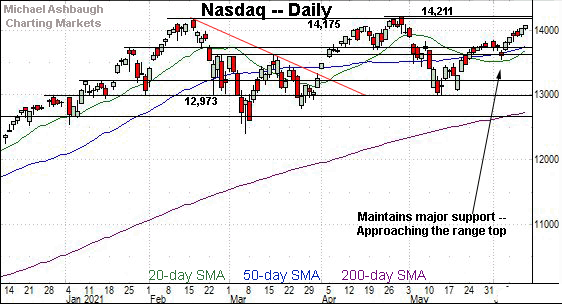
Widening the view to six months adds perspective.
On this wider view, the Nasdaq has extended its rally attempt, rising amid rotational June price action.
Recent follow-through punctuates a jagged test of major support matching the March peak (13,620). The June closing low (13,614) registered nearby.
Conversely, overhead inflection points match the Nasdaq’s record close (14,138.77), the Feb. peak (14,175) and the absolute record peak (14,211.57).
Monday’s early session high (14,127) has registered within view of the record close.
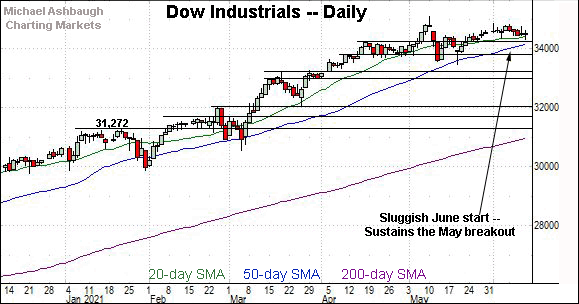
Looking elsewhere, the Dow Jones Industrial Average continues to pull in slightly as the Nasdaq extends higher.
Still, the Dow’s backdrop remains comfortably bullish despite sluggish June price action.
Tactically, the breakout point (34,454) is followed by the April peak (34,256), areas also detailed on the hourly chart.
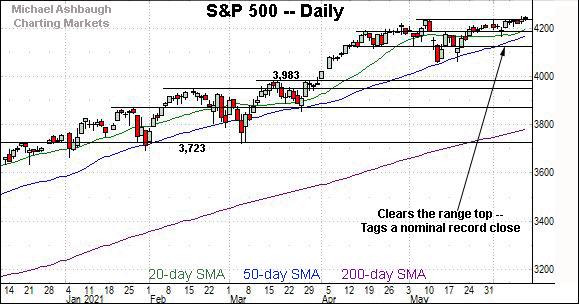
Meanwhile, the S&P 500 continues to press record highs.
The prevailing pulling-teeth breakout attempt punctuates a relatively tight three-week range.
The bigger picture
As detailed above, the U.S. benchmarks are acting well technically.
On a headline basis, the S&P 500 continues to challenge record highs amid still rotational price action.
Against this backdrop, the Nasdaq Composite has extended its June breakout — rising within view of its record close — while the Dow Jones Industrial Average has extended a modest pullback.
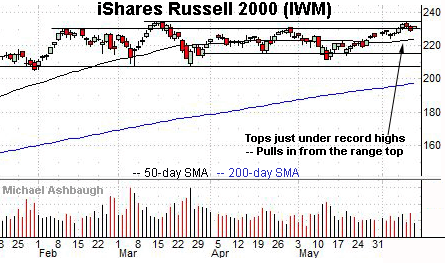
Moving to the small-caps, the iShares Russell 2000 ETF has stalled near its range top.
The small-cap benchmark’s record close (234.42) and absolute record peak (234.53) remain just overhead.
More broadly, the prevailing upturn punctuates a prolonged five-month range, laying the groundwork for potentially decisive follow-though.
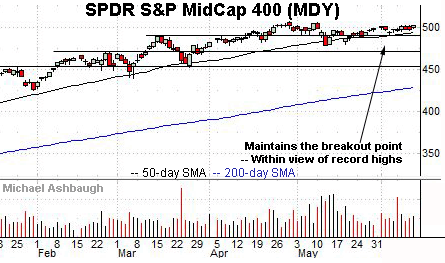
Meanwhile, the SPDR S&P MidCap 400 has registered comparably sluggish June price action.
Still, the MDY’s record close (504.81) and absolute record peak (507.63) remain within striking distance.
Placing a finer point on the S&P 500, the index continues to press record territory.
Consider that last week’s close marked a record close (4,247.44) and registered just under the S&P’s absolute record peak (4,249.74) established Thursday.
The prevailing upturn originates from a successful test of the April peak (4,218).
More broadly, the S&P 500 continues to challenge its range top, rising from a tight three-week range.
Tactically, the S&P’s former breakout point (4,191) is followed by the the ascending 50-day moving average, currently 4,171, and the June low (4,168). A sustained posture higher signals a comfortably bullish intermediate-term bias.
Conversely, a near- to intermediate-term target continues to project from the S&P’s May range to the 4,310 area. Beyond specific levels, the markets’ response to the Federal Reserve’s policy statement, due out Wednesday, will likely add color.
Editor’s Note: The next review will be published Wednesday.
Watch List
Drilling down further, consider the following sectors and individual names:
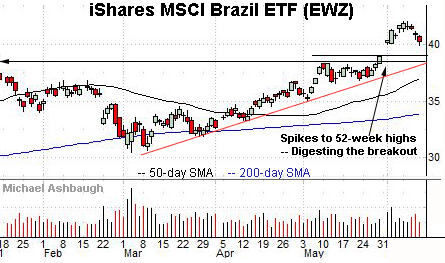
To start, the iShares MSCI Brazil ETF is acting well technically. (Yield = 1.8%.)
The shares started June with a decisive breakout, gapping to 52-week highs.
The ensuing pullback has been orderly, placing the shares near gap support (40.00) and 4.3% under the June peak.
Delving deeper, trendline support closely matches the breakout point (39.00) and is rising toward the bottom of the gap (38.30). The prevailing rally attempt is intact barring a violation.
More broadly, the shares are well positioned on the five-year chart, placing distance atop the 200-week moving average.
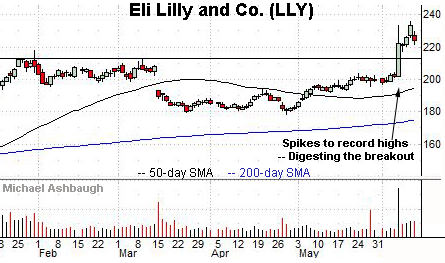
Eli Lilly and Co. is a well positioned large-cap pharmaceutical name. (Yield = 1.5%.)
Earlier this month, the shares knifed to record highs, rising after a competitive FDA approval stirred optimism over the approval prospects for Lilly’s Alzheimer’s disease treatment.
Though still near-term extended, the strong-volume spike to previously uncharted territory is longer-term bullish. Tactically, the post-breakout low (217.40) is followed by the breakout point (212.70).
Elsewhere, rivals AstraZeneca and Bristol-Myers Squibb are also setting up well amid bullish June price action.
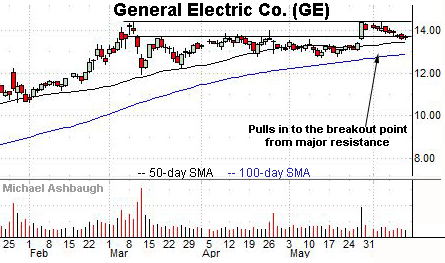
General Electric Co. is a well positioned large-cap name.
The shares initially spiked two weeks ago, rising after the company reported a reduced cash-burn rate as well as multiple new supply contracts. (The May peak (14.40) missed GE’s three-year high (14.42) by just two cents.)
The subsequent pullback places the shares near the breakout point (13.60) and 5.3% under the May peak.
Delving slightly deeper, gap support (13.43) closely matches the 50-day moving average, currently 13.45. A sustained posture higher signals a bullish bias.
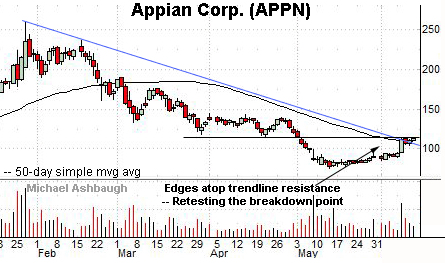
Appian Corp. is a large-cap software vendor showing signs of life.
Technically, the shares have edged atop trendline resistance closely tracking the 50-day moving average.
The prevailing tight three-session range — formed amid decreased volume — lays the groundwork for a potentially more decisive trendline breakout.
Tactically, sustained follow-through atop the breakdown point (114.45) would confirm the prevailing trend shift.
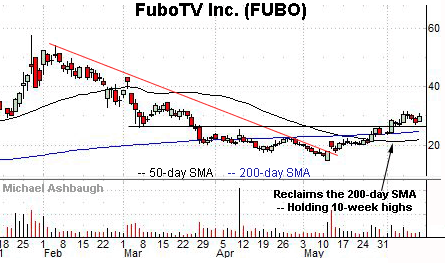
Finally, FuboTV, Inc. is a mid-cap live-streaming TV platform operator. Note this name is heavily-shorted.
The shares started June with a strong-volume breakout, rising after the company updated its app dashboard to include live sports statistics. (The move stirred speculation about the prospect of future live live sports betting.)
The subsequent flag-like pattern positions the shares to extend the rally attempt. Tactically, a sustained posture atop the former breakdown point (26.10) and the 200-day moving average signals a bullish bias.
Editor’s Note: The next review will be published Wednesday.


