Charting a bullish trend shift, Nasdaq extends trendline breakout
Focus: Regional banks stage stealth breakout attempt, KRE, BCRX, WPM, CNC, DSX
U.S. stocks are firmly higher early Monday, building on last week’s respectable bullish reversal.
Against this backdrop, the S&P 500 has ventured atop major resistance (4,191) while the Nasdaq Composite has extended a key trendline breakout, rising amid a potential trend shift.
Editor’s Note: As always, updates can be directly accessed at chartingmarkets.substack.com.
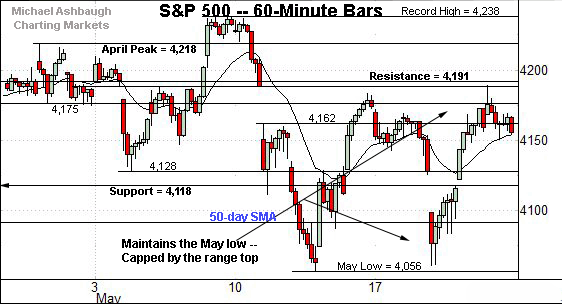
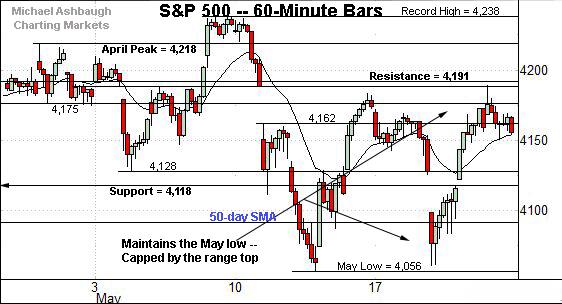
Before detailing the U.S. markets’ wider view, the S&P 500’s hourly chart highlights the past four weeks.
As illustrated, the S&P has rallied respectably from the May low, rising to press the range top (4,191).
Last week’s high (4,189) registered nearby, and the index has followed through atop resistance early Monday. As always, it’s the session close that matters.
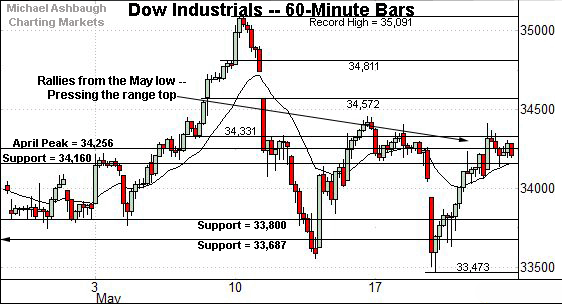
Meanwhile, the Dow Jones Industrial Average is also pressing familiar overhead.
Tactically, the April peak (34,256) is followed by the 34,330 area and more distant gap resistance (34,572).
Against this backdrop, the Nasdaq Composite’s backdrop has strengthened in recent sessions.
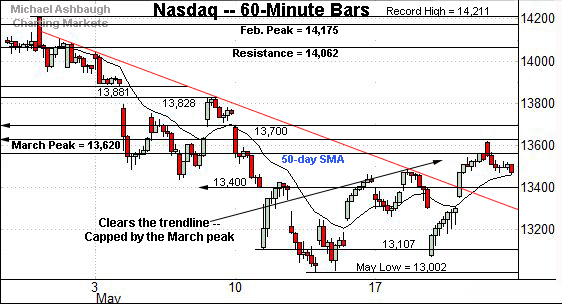
As illustrated, the index has cleared trendline resistance, rising to challenge the March peak (13,620), a bull-bear fulcrum detailed repeatedly.
Last week’s high (13,616) roughly matched resistance, and the Nasdaq has followed through higher early Monday.
More broadly, the trendline breakout — and last week’s “higher high” — signal a near-term trend shift.
Widening the view to six months adds perspective.
On this wider view, the Nasdaq has extended a bullish reversal from the 13,000 area.
Overhead inflection points match the 50-day moving average, currently 13,585, and the March peak (13,620). As detailed previously, follow-through atop these areas would signal a bullish shift in the Nasdaq’s intermediate-term bias.
On further strength, the prevailing backdrop is cluttered with overhead inflection points. The Jan. peak (13,729) is followed by the early-May gap (13,795) and the post-breakdown peak (13,828).
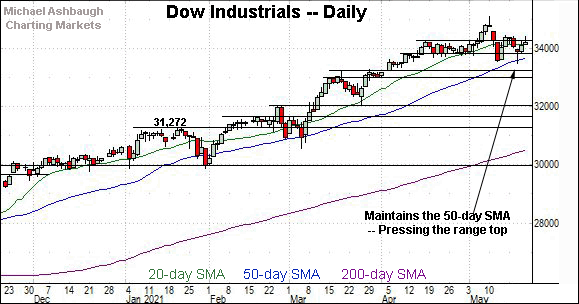
Looking elsewhere, the Dow industrials’ backdrop remains comparably straightforward.
Technically, the index has registered a bullish reversal from the 50-day moving average, rising to challenge the April peak (34,256).
The Dow has ventured atop resistance early Monday, reaching less-charted territory.
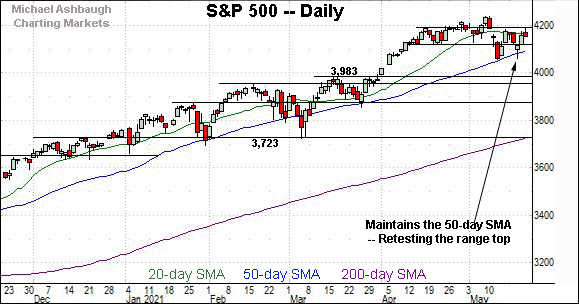
Meanwhile, the S&P 500 has weathered consecutive retests of the 50-day moving average, currently 4,096.
More immediately, the index is challenging its range top (4,191) early Monday.
The bigger picture
Collectively, the U.S. benchmarks’ bigger-picture backdrop has strengthened in recent sessions.
On a headline basis, the Nasdaq Composite has staged a trendline breakout, also notching a “higher high” vs. the mid-May peak.
Moreover, the Nasdaq has followed through atop the March peak (13,620) early Monday, a key intermediate-term inflection point, detailed previously. Sustained through atop the March peak (13,620) would signal a bullish shift in the intermediate-term bias.
Elsewhere, the S&P 500 and Dow industrials have retained a bullish intermediate-term bias throughout the May volatility spike.
Moving to the small-caps, the iShares Russell 2000 ETF continues to flatline.
A retest of the 50-day moving average, currently 222.44, remains underway.
True to recent form, the SPDR S&P MidCap 400 remains comparably stronger.
The MDY reclaimed its breakdown point (489.50) to conclude last week.
Placing a finer point on the S&P 500, the index has asserted a range amid volatile May price action.
The prevailing upturn punctuates a developing double bottom — the W formation — defined by the May lows. Sustained follow-through atop the mid-May peak (4,183) would technically resolve the bullish pattern.
More broadly, the S&P 500 has rallied to its former range, and is challenging familiar resistance (4,191).
On further strength, the S&P’s record close (4,232.60) is closely followed by the absolute record peak (4,238.04).
More broadly, the S&P 500’s recent tandem bullish reversals from the 50-day moving average preserve a still comfortably bullish intermediate-term bias.
Watch List
Drilling down further, consider the following sectors and individual names:
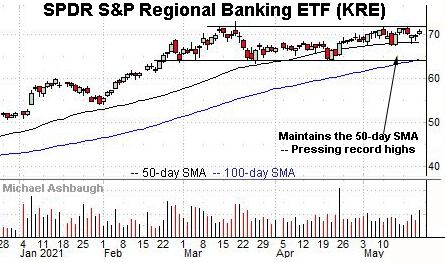
To start, the SPDR S&P Regional Banking ETF is acting well technically. (Yield = 2.1%.)
As illustrated, the group has rallied toward the range top, within view of record highs.
The prevailing upturn punctuates a relatively tight May range, laying the groundwork for a potentially decisive breakout.
Tactically, the 50-day moving average, currently 68.20, has effectively underpinned the prevailing range. A breakout attempt is in play barring a violation.
BioCryst Pharmaceuticals, Inc. is a well positioned mid-cap biotech name.
Earlier this month, the shares knifed to five-year highs, rising after the company received U.K. regulatory approval for its hereditary angioedoma (HAE) treatment.
The subsequent pullback places the shares 8.0% under the May peak.
Tactically, the breakout point (13.90) is followed by the former range top (13.10). A sustained posture higher signals a firmly-bullish bias.
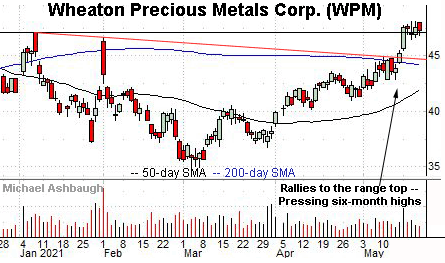
Wheaton Precious Metals Corp. is a large-cap Vancouver-based gold and silver miner.
Technically, the shares have recently knifed atop the 200-day moving average, rising to challenge six-month highs.
The prevailing flag-like pattern — (the tight one-week range) — signals muted selling pressure near resistance, positioning the shares to build on the mid-May spike.
Tactically, trendline support is closely followed by the 200-day moving average. The prevailing rally attempt is intact barring a violation.
Initially profiled May 17, Centene Corp. has broken out.
Specifically, the shares have knifed to 52-week highs, clearing resistance matching the January peak. The upturn builds on the sharp early-May spike to the range top.
Though near-term extended, and due to consolidate, the strong-volume spike is longer-term bullish. Tactically, the breakout point (70.50) pivots to well-defined support.
(On a granular note, the shares are also well positioned on the three-year chart, challenging major resistance matching the 2018 and 2019 peaks.)
Finally, Diana Shipping, Inc. is a small-cap Greece-based dry bulk shipping name.
As illustrated, the shares have sustained a break to 34-month highs.
The prevailing upturn punctuates an orderly early-May range, hinged to a double bottom defined by the March and April lows. Tactically, a sustained posture atop the breakout point (4.10) signals a bullish bias.


