Charting a failed breakout attempt, Nasdaq retests 50-day average
Metals & mining sector tags six-year high, Gold sustains bullish trend shift, XME, GLD, FCX, FDX, VRSN
U.S. stocks are lower early Tuesday, pressured amid renewed technology sector selling pressure, and as the worst six-month seasonal period gets underway.
Against this backdrop, the Nasdaq Composite has extended its May downturn, pulling it to retest the 50-day moving average, currently 13,512. Tuesday’s early session low (13,517) has registered nearby.
Editor’s Note: As always, updates can be accessed at chartingmarkets.substack.com. Your smartphone smartphone can also access updates at the same address, chartingmarkets.substack.com.
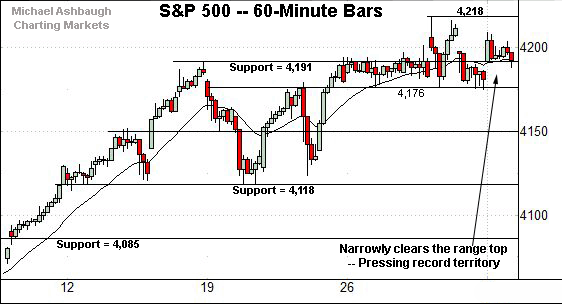
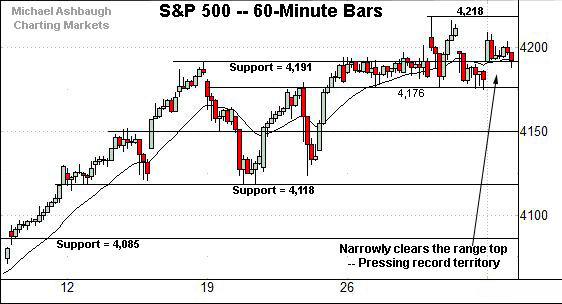
Before detailing the U.S. markets’ wider view, the S&P 500’s hourly chart highlights the past four weeks.
As illustrated, the S&P has registered a bull-bear stalemate near the range top (4,191).
Monday’s close (4,192) more or less matched the inflection point, and the index is on the defensive early Tuesday.
Tactically, the 4,150 area is followed by a firmer floor matching the three-week range bottom (4,118).
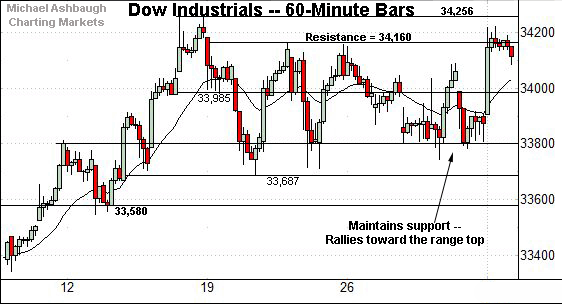
Perhaps not surprisingly, the Dow Jones Industrial Average remains range-bound.
Tactically, the 33,800 area underpinned last week’s price action and is followed by the three-week range bottom (33,687).
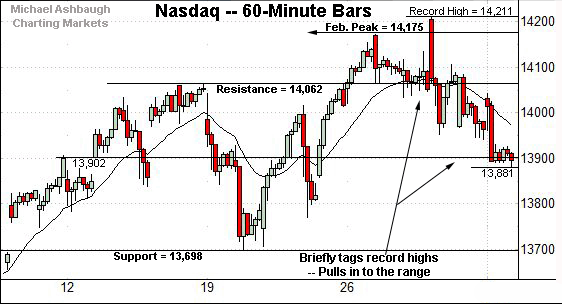
Meanwhile, the Nasdaq Composite has extended a pullback from last week’s record high.
From current levels, the prevailing range bottom, circa 13,700, is followed by the March peak (13,620) and gap support (13,582), detailed previously.
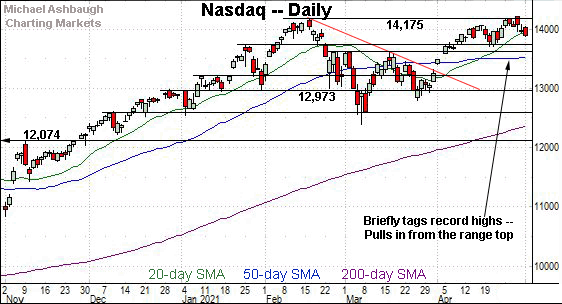
Widening the view to six months adds perspective.
On this wider view, the Nasdaq has extended a pullback from its range top (14,175).
Last week’s bearish single-day reversal — the failed breakout attempt — has indeed followed through lower with the benefit of this week’s sluggish start.
Tactically, the prevailing range bottom, circa 13,700, is followed by the March peak (13,620) and the flatlining 50-day moving average, currently 13,512. A sustained posture atop this area signals a bullish intermediate-term bias.
Tuesday’s early session low (13,517) has registered uncomfortably near the 50-day moving average.
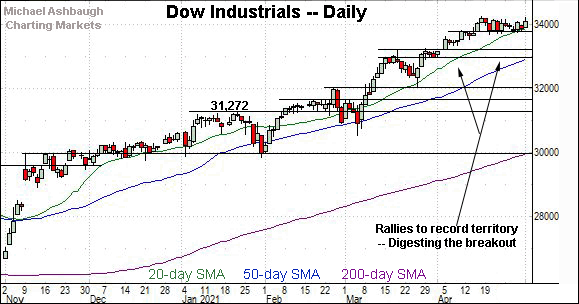
Looking elsewhere, the Dow Jones Industrial Average has asserted a tight nearly three-week range.
Tactically, near-term support (33,800) is followed by prevailing range bottom (33,687), areas also illustrated on the hourly chart.
Delving deeper, the April gap (33,222) marks an inflection point.
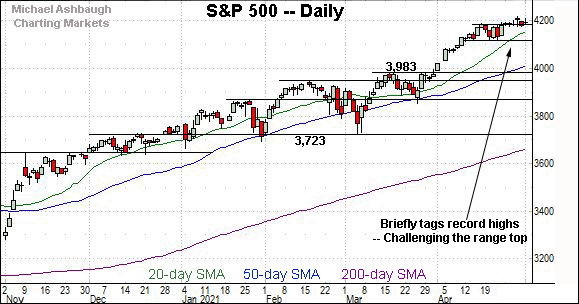
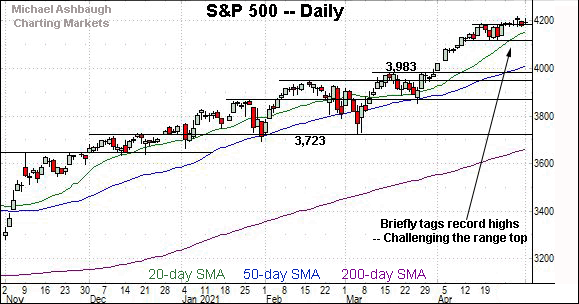
Meanwhile, the S&P 500 has hugged its range top amid a prolonged breakout attempt.
Still, Tuesday’s early downturn seems to have placed pending upside follow-through on hold. Tactically, the mid-April range bottom (4,118) marks an inflection point.
The bigger picture
U.S. stocks are lower early Tuesday, pressured amid renewed technology sector selling pressure, and as the worst six-month seasonal periods gets underway.
Against this backdrop, the bigger-picture technicals remain broadly bullish, though the prevailing downturn is worth tracking for potential acceleration. The Nasdaq Composite and S&P 500 have just registered failed late-April breakout attempts.
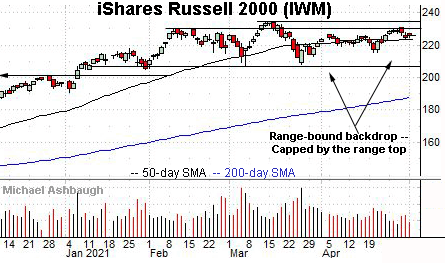
Moving to the small-caps, the iShares Russell 2000 ETF remains range-bound.
Tactically, the 50-day moving average, currently 223.24, is followed by the April range bottom (215.24).
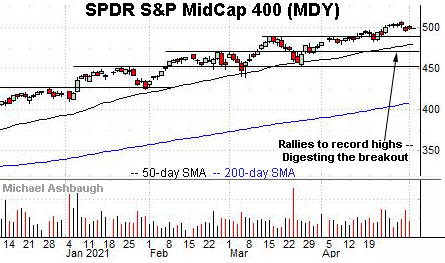
Meanwhile, the SPDR S&P MidCap 400 remains incrementally stronger.
Tactically, the breakout point, circa 489.50, marks the MDY’s first notable floor. (See the March peak (489.48) and early-April peak (489.47).)
Placing a finer point on the S&P 500, the index has apparently balked at its range top (4,191).
To reiterate, the 4,150 area is followed by a firmer floor matching the three-week range bottom (4,118).
More broadly, the S&P’s former projected target (4,085) is followed by the 50-day moving average, currently 4,014.
Delving deeper, the breakout point (3,983) marks the S&P’s first significant support.
As always, it’s not just what the benchmarks do, it’s how they do it. But broadly speaking, a sustained posture atop the S&P 3,980 area signals a bullish intermediate-term bias.
Tuesday’s Watch List
Drilling down further, consider the following sectors and individual names:
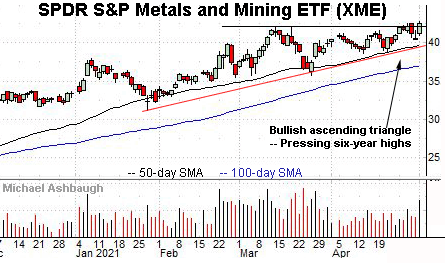
To start, the SPDR S&P Metals & Mining ETF is acting well technically.
As illustrated, the group has rallied to tag a six-year closing high. The prevailing upturn punctuates an ascending triangle, hinged to the January low.
Tactically, trendline support closely the tracks the 50-day moving average, currently 39.75. A breakout attempt is in play barring a violation.
Note the strong May start has been fueled by increased volume, improving the chances of potentially more decisive follow-through.
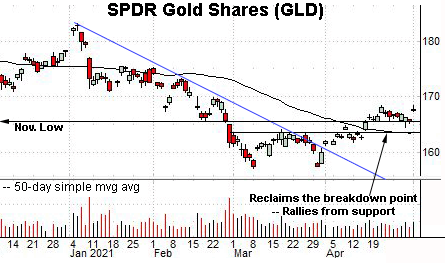
Meanwhile, the SPDR Gold Shares ETF — profiled last week — has thus far sustained its April trend shift.
Tactically, notable support matches the former breakdown point, circa 165.70, detailed previously.
The April close (165.66) — also last week’s closing low — registered nearby amid a shaky retest.
Delving deeper, familiar support matches the former range top (163.50) and the 50-day moving average, currently 163.49. The prevailing rally attempt is intact barring a violation.
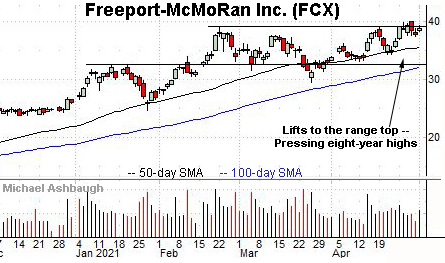
Moving to specific names, Freeport-McMoRan, Inc. is a large-cap copper and gold miner.
This is the second-largest component of the SPDR S&P Metals & Mining ETF (XME) — detailed previously — accounting for about a 5.6% weighting.
As illustrated, the shares are challenging eight-year highs. The prevailing tight one-week range signals muted selling pressure near major resistance, improving the chances of eventual follow-through.
Tactically, the range bottom (37.45) is followed by the 50-day moving average, currently 35.44, an April inflection point. A breakout attempt is in play barring a violation.
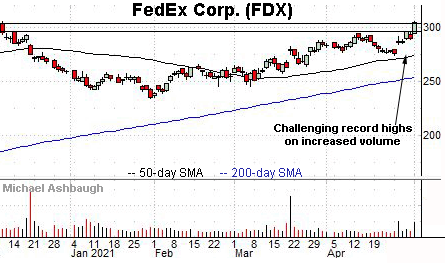
FedEx Corp. is a large-cap transportation sector bellwether coming to life.
Technically, the shares have tagged a record close, thus far missing an absolute record peak by just 26 cents.
The prevailing upturn has been fueled by tandem volume spikes — across just five sessions — to punctuate a modified cup-and-handle defined by the January and April lows. A near-term target projects to the 307 area on follow-through.
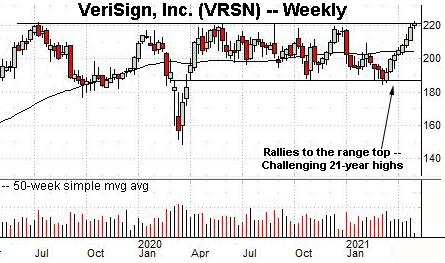
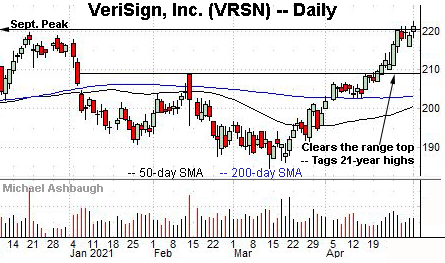
Finally, VeriSign, Inc. is a large-cap provider of domain registry and internet infrastructure services.
As illustrated, the shares have rallied tagged 21-year highs, the best level since March 2000, as the dotcom bubble crested.
The prevailing upturn punctuates a prolonged one-year range, illustrated on the weekly chart above. An intermediate-term target projects to the 248 area on follow-through.
Conversely, a breakout attempt is in play barring a violation of near-term support, circa 216.00.


