Market rotation persists, Nasdaq Composite retests major support (14,860)
Focus: S&P 500 maintains 50-day average, Russell 2000's bearish backdrop persists
U.S. stocks are mixed mid-day Friday, vacillating after a weaker-than-expected monthly jobs report.
Against this backdrop, the S&P 500 has weathered a stealth retest of its 50-day moving average, while the Nasdaq Composite seems to have survived a test of more important technical support (14,860). At least for now.
Editor’s Note: As always, updates can be directly accessed at chartingmarkets.substack.com.
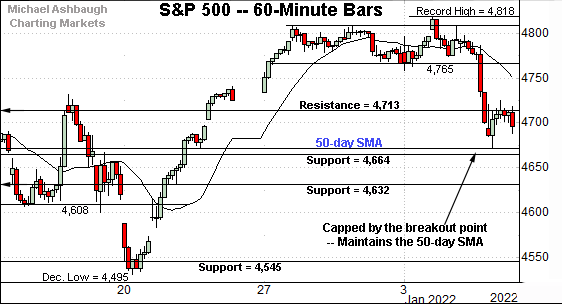
Before detailing the U.S. markets’ wider view, the S&P 500’s hourly chart highlights the past four weeks.
As illustrated, the S&P has pulled in from record territory.
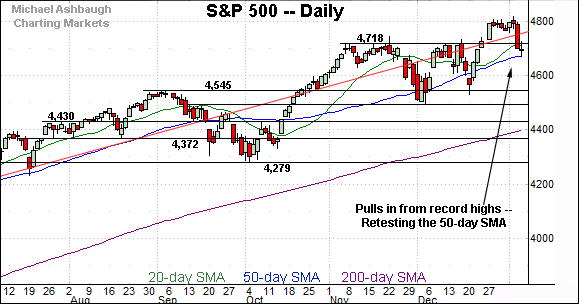
The downturn places the index under major support — the 4,713-to-4,718 area, detailed previously — an area that pivots to resistance.
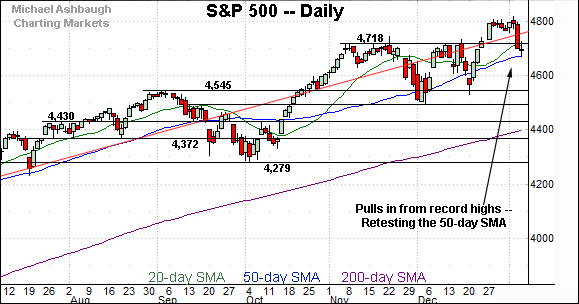
Delving deeper, the S&P has initially maintained its 50-day moving average, currently 4,674.
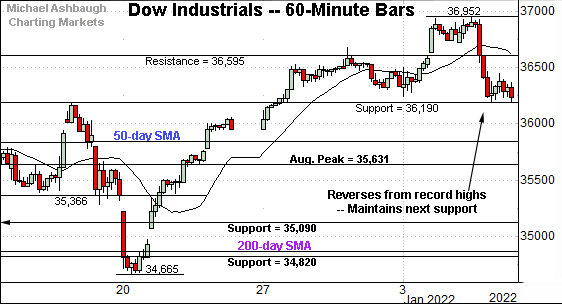
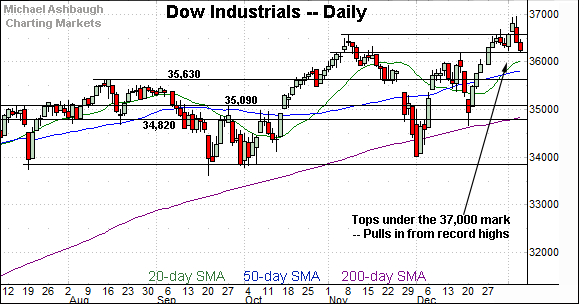
Similarly, the Dow Jones Industrial Average has pulled in from its latest record high.
The initial downturn has been underpinned by the late-December breakout point (36,190).
Delving deeper, the 50-day moving average, currently 35,814, is followed by major support (35,631) better illustrated on the daily chart.
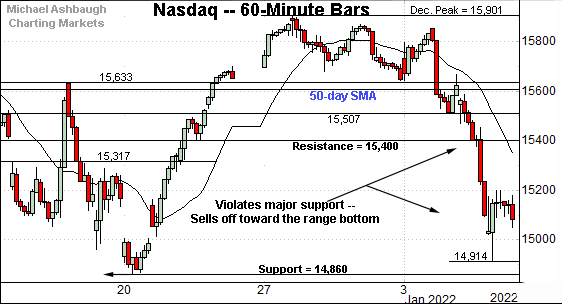
Against this backdrop, the Nasdaq Composite has pulled in more aggressively, plunging toward its one-month range bottom.
The prevailing downturn punctuates a violation of major support — the 15,400 area — also illustrated below.
More immediately, the Nasdaq’s next significant floor (14,860) — detailed previously — is firmly within view.
Friday’s early session low (14,877) has registered nearby.
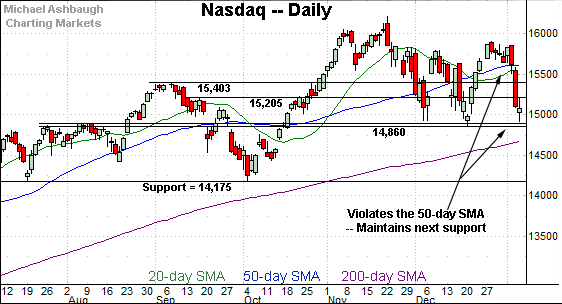
Widening the view to six months adds perspective.
On this wider view, the Nasdaq has violated major support.
Consider that Wednesday’s violation of the 50-day moving average — and the 15,400 area — marked a massive 3.3% single-day downdraft, the Nasdaq’s worst day since February.
Delving deeper, the 14,860 area marks a potentially important floor.
Tactically, a violation of this area would mark a material “lower low” likely opening the path to an eventual retest of the 200-day moving average, currently 14,681.
(On a granular note, the 14,860 support matches the July peak (14,863) and December low (14,860).)
Looking elsewhere, the Dow Jones Industrial Average continues to outperform.
Nonetheless, the index has reversed from this week’s record high.
Tactically, initial support — the 36,190 area — is also detailed on the hourly chart.
Delving deeper, the Dow’s former breakout point (35,630) marks its first significant floor. The prevailing backdrop supports a bullish intermediate-term bias barring a violation of this area.
More broadly, recall the prevailing leg higher originates from a successful test of the 200-day moving average at the mid-December low.
Similarly, the S&P 500 has pulled in from its recent record high.
The downturn places it back under its breakout point — the 4,713-to-4,718 area — also detailed on the hourly chart.
Delving deeper, the S&P has initially maintained its 50-day moving average, currently 4,674. An extended retest remains underway Friday.
The bigger picture
As detailed above, the major U.S. benchmarks remain in divergence mode. Each index is doing different things.
On a headline basis, the S&P 500 and Dow industrials briefly tagged record highs to start the New Year, and have subsequently pulled in. Each benchmark’s intermediate-term bias remains bullish.
Meanwhile, the Nasdaq Composite has not tagged record highs. Instead, the index has knifed firmly under major support (15,400), pressured amid its worst single-day downdraft in about 11 months.
Beyond the details, market rotation persists amid this week’s volatility surge. Broadly speaking, the cyclicals have outperformed at the expense of the technology sector.
(See Wednesday’s review, detailing key sector breakouts — the financials and energy sector.)
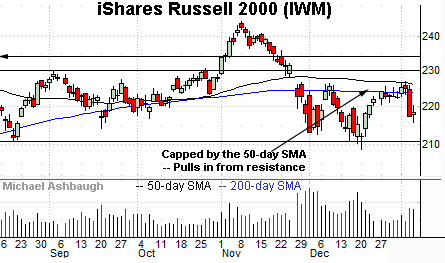
Moving to the small-caps, the iShares Russell 2000 ETF is not acting well technically.
As illustrated, the IWM has stalled near its 50-day moving average, a level matching the November gap. (The November gap is the omicron-fueled gap.)
Moreover, the prevailing downturn has been fueled by increased volume to punctuate a previously lackluster rally attempt.
Tactically, eventual upside follow-through atop the 226.75-to-227.15 area would place the small-cap benchmark on firmer technical ground.
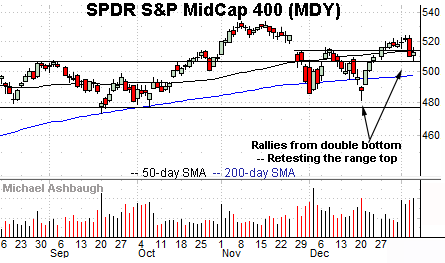
Meanwhile, the SPDR S&P MidCap 400 ETF continues to outpace the Russell 2000.
Technically, the MDY has filled the late-November gap — (the omicron-fueled gap) — to punctuate a mini double bottom defined by the December lows.
The subsequent pullback, this week, has been underpinned by the former range top (507.30). Constructive price action, in the broad sweep.
Placing a finer point on the S&P 500, the index has pulled in respectably from its record high (4,818), established Tuesday.
Tactically, the breakout point — the 4,713-to-4,718 area, also illustrated below — pivots to resistance.
More broadly, the S&P 500 has pulled in to its 50-day moving average, currently 4,674, just three days removed from its recent record high.
The downturn has been punctuated by a common doji — the cross pattern — characterized by a session open and close that closely match. Generally speaking, the doji signals hesitation, or indecision, as to the immediate trend. (This can be useful when the pattern registers at, or near, trend extremes.)
Delving deeper, the S&P’s former breakout point (4,545) continues to mark likely last-ditch support. Recall last month’s respectable bullish reversal from support, fueled by nearly 7-to-1 positive breadth.
Broadly speaking, the S&P 500’s intermediate-term bias remains bullish barring a violation of the 4,545 area.
No new setups today. Back in action Monday.


