


Market bears resurface, S&P 500 challenges major support (5,878)
Focus: Major benchmarks test key levels amid 9-to-1 market down day

Technically speaking, the major U.S. benchmarks have registered a volatility spike, pulling in to test important support.
Amid the downturn, market internals registered bearish extremes — in the form of a 9-to-1 down day — signaling a “watch out” for potential downside follow-through. Several key technical tests remain underway, and will likely add color.
Editor’s Note: As always, updates can be directly accessed at chartingmarkets.substack.com.
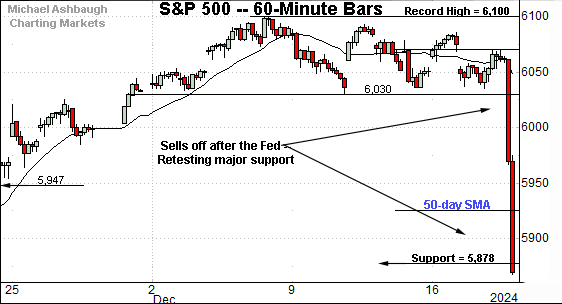
Before detailing the U.S. markets’ wider view, the S&P 500’s hourly chart highlights the past four weeks.
As illustrated, the S&P 500 did not respond well to the Federal Reserve’s latest policy directive.
The massive 2.9% single-day downdraft places the index under its 50-day moving average, currently 5,925. More immediately, a retest of major support (5,878) remains underway. (This area is better illustrated on the daily chart.)
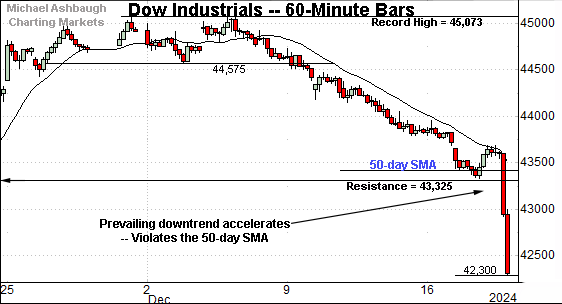
Meanwhile, the Dow Jones Industrial Average has extended a downturn from recent record highs.
In the process, the index has violated its 50-day moving average, currently 43,460, as well as major support (43,325). This area pivots to resistance.
Separately, notice the Dow’s near-term trends continue to track the 20-hour moving average. (See the Dec. 3 review.) The Fed-fueled downdraft originated from the 20-hour moving average.
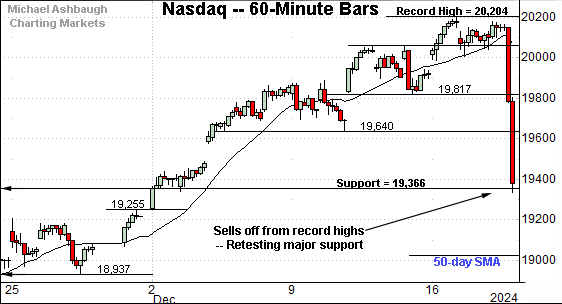
Against this backdrop, the Nasdaq Composite has reversed sharply from record territory.
The prevailing downturn places major support (19,366) back in play, an area also detailed below.
On a positive note, the Nasdaq is the lone major U.S. benchmark still positioned atop its 50-day moving average (in blue).
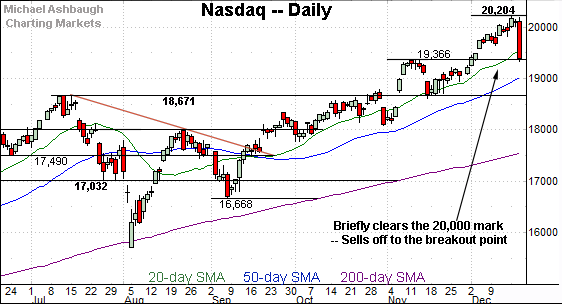
Widening the view to six months adds perspective.
On this wider view, the Nasdaq has pulled in to major support (19,366), pressured amid a 3.5% single-day downdraft.
On further weakness, the 50-day moving average, currently 19,017, is followed by the November breakout point (18,671), an area that has underpinned the index since the U.S. election.
The Nasdaq’s intermediate-term bias remains bullish barring a violation of this area.
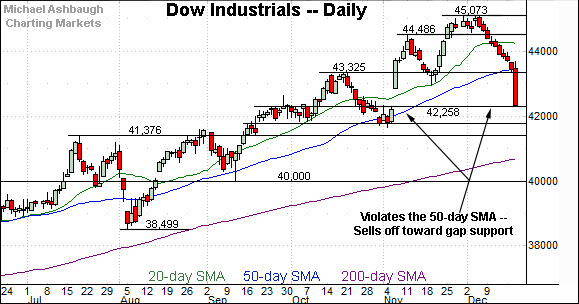
Looking elsewhere, the Dow Jones Industrial Average has registered a 10-session losing streak, its longest stretch in 50 years.
The downturn accelerated amid a violation of major support. Specifically, the 50-day moving average and the November breakout point (43,325).
Delving deeper, gap support (42,258) is followed by the September breakout point (41,376).

Meanwhile, the S&P 500 has reversed sharply from recent record highs.
The single-day downdraft places the S&P back under its 50-day moving average, currently 5,925. Separately, a retest of the breakout point (5,878) remains underway.
The bigger picture
As detailed above, the major U.S. benchmarks have reversed course — at least for the near-term — pressured amid an aggressive single-day downdraft.
And from a technical standpoint, the Fed-fueled plunge is notable because the underlying internals registered bearish extremes. Specifically, NYSE declining volume surpassed advancing volume by an unusually strong 9-to-1 margin.
As always, two 9-to-1 down days — across about a seven-session window — reliably signal a material trend shift.
So the prevailing backdrop is unusual in the sense that consequential price action does not frequently register this late in the year. Time will tell whether this ultimately represents a “one-day wonder,” of sorts, or the early stages of more pronounced market weakness. (Fed-fueled volatility is generally not consequential, but this particular session was not a garden-variety market move.)
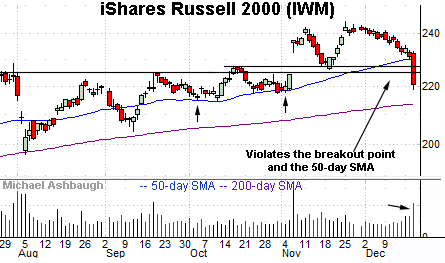
Moving to the small-caps, the iShares Russell 2000 ETF (IWM) has also turned lower.
In the process, the small-cap benchmark has violated its 50-day moving average and major support matching the breakout point, circa 224.50.
This area pivots to resistance. The pending retest from underneath will likely add color.
(Recall the 50-day moving average offered support ahead of the U.S. election.)
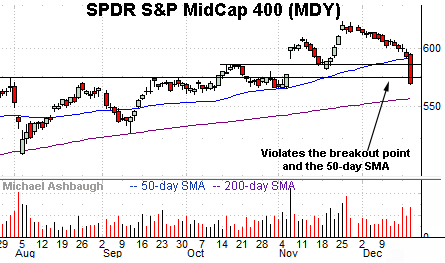
Similarly, the SPDR S&P MidCap 400 ETF (MDY) has extended a December downturn.
Here again, the strong-volume plunge places the MDY under its 50-day moving average and the November breakout point.
Tactically, a swift reversal atop the 577-to-581 area would mark a step toward stabilization. The pending response to this area is worth tracking.
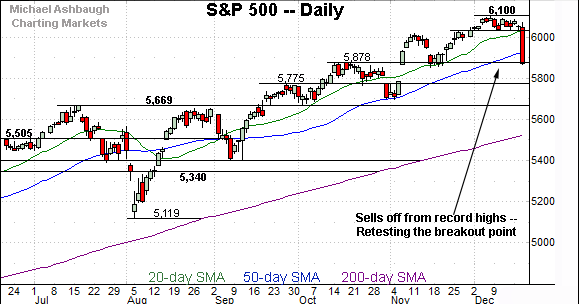
Returning to the S&P 500, the index just registered its worst “Fed-day” downdraft since 2013.
In the process, the index has ventured under its 50-day moving average, currently 5,925, for the first time since September.
Tactically, the S&P’s breakout point (5,878) is closely followed by the election-fueled gap (5,864). So slightly broadly speaking, the 5,864-to-5,878 area marks a notable floor.
Delving deeper, the 5,775 area is followed by major support matching the S&P’s former breakout point (5,669). (The 5,670 support rests about 3.5% incrementally lower from current levels.)
As always, it’s not just what the markets do, it’s how they do it.
In the current case, the single-day downdraft signals a “watch out” for potential downside follow-through. The 9-to-1 down day amid seasonally less liquid conditions is less than ideal.
But strictly speaking, the S&P’s intermediate-term bias remains bullish barring a violation of the 5,670 area. The next several sessions will likely add color.
Also see Dec. 3: Charting bullish follow-through, U.S. benchmarks reach uncharted territory.