


Charting bullish follow-through, U.S. benchmarks reach uncharted territory
Focus: Nasdaq Composite approaches the 20,000 mark

Technically speaking, the major U.S. benchmarks continue to trend steadily higher.
Amid the upturn, each big three benchmark has tagged an all-time high to start December, reaching previously uncharted territory. The charts below add color:
Editor’s Note: As always, updates can be directly accessed at chartingmarkets.substack.com.
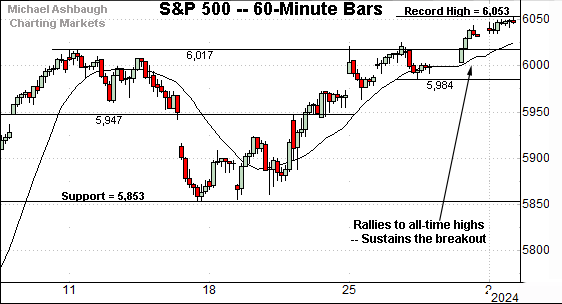
Before detailing the U.S. markets’ wider view, the S&P 500’s hourly chart highlights the past four weeks.
As illustrated, the S&P 500 has rallied to its latest all-time high, placing distance atop the 6,000 mark.
The slight breakout punctuates a shallow 2.7% pullback from the early-November peak. Tactically, the breakout point (6,017) pivots to first support.
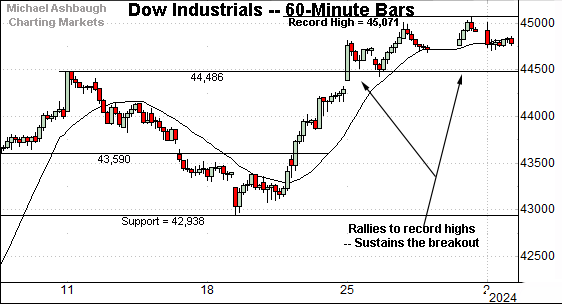
Meanwhile, the Dow Jones Industrial Average has sustained a slightly more decisive breakout.
Amid the upturn, notice the 20-hour moving average has defined the very near-term trends. Tactically, the breakout point (44,486) marks first support.
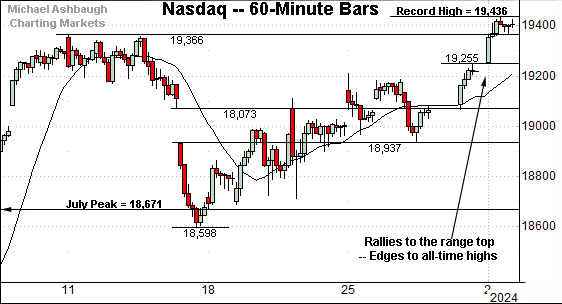
Against this backdrop, the Nasdaq Composite has narrowly tagged a new record high.
The prevailing upturn punctuates a 3.9% pullback from the early-November peak, as well as a successful test of major support (18,671) also illustrated below.
Combined, each big three U.S. benchmark continues to press all-time highs.
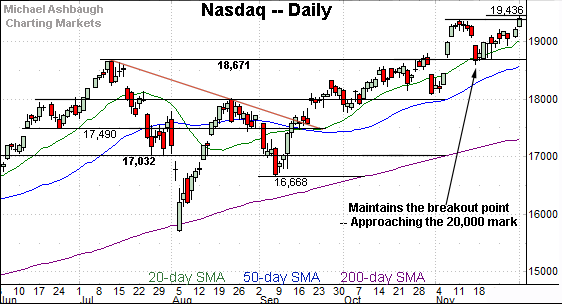
Widening the view to six months adds perspective.
On this wider view, the Nasdaq continues to trend higher.
Amid the upturn, the early-November spike has been punctuated by a successful test of the breakout point (18,671). The mid-November closing low (18,680) registered within nine points. (Also see the Nov. 14 review.)
More immediately, the Nasdaq has rallied from support to tag a nominal record high.
Tactically, the 50-day moving average, currently 18,600, is rising toward the breakout point. A posture atop this area signals a bullish intermediate-term bias.
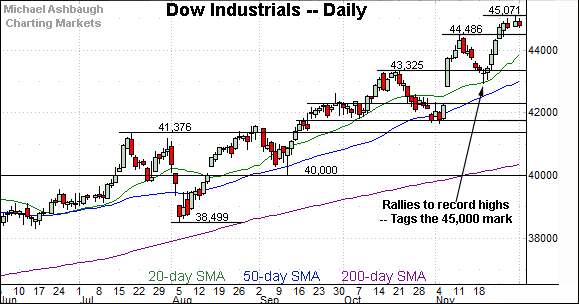
Looking elsewhere, the Dow Jones Industrial Average has broken out more aggressively, rising to briefly clear the 45,000 mark for the first time on record.
Tactically, the breakout point (44,486) is followed by a deeper floor matching the November peak (43,325).

Meanwhile, the S&P 500 has also edged to another record high.
Like the Nasdaq, the S&P’s prevailing upturn originates from its breakout point (5,878). The mid-November closing low (5,870) registered within eight points.
The bigger picture
As detailed above, the major U.S. benchmarks continue to trend higher.
Amid the upturn, each big three benchmark has reached record terrritory — meaning previously uncharted territory — to start December.
(On a granular note, recall the early-November rallies marked two standard deviation breakouts, signaling unusually powerful bullish momentum. The more recent record highs represent “the expected” follow-through on those initial spikes. Bullish price action.)
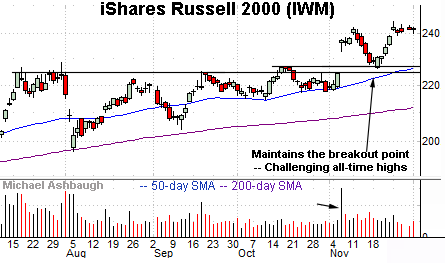
Moving to the small-caps, the iShares Russell 2000 ETF (IWM) is also acting well technically.
As illustrated, the early-November spike has been punctuated by an orderly pullback, and successful test of the breakout point.
More immediately, the prevailing rally from support has been punctuated by a tight one-week range — also known as a bull flag — just under all-time highs.
Tactically, the 50-day moving average, currently 226.60, closely matches the breakout point (227.20). A sustained posture atop this area signals a bullish bias.
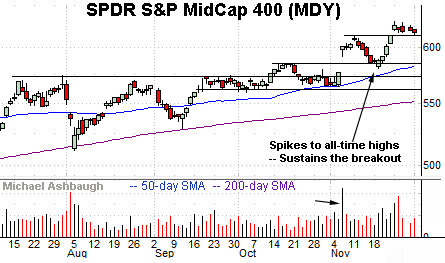
Meanwhile, the SPDR S&P MidCap 400 ETF (MDY) has sustained a slightly more decisive break to record territory.
Here again, the prevailing flag-like pattern — the tight one-week range — is hinged to the steep mid-November rally. Bullish price action. (Also see the Nov. 14 review.)
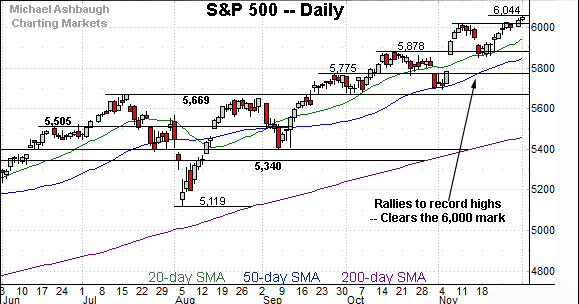
Returning to the S&P 500, its bigger-picture backdrop remains straightforward.
As illustrated, the S&P has edged to its latest record high, rising from a successful test of its breakout point (5,878) detailed previously. The mid-November closing low (5,870) registered nearby.
Slightly more broadly, the prevailing upturn originates from a bullish island reversal. The pattern is defined by the late-October gap lower and early-November gap higher, encompassing four sessions underpinned by the 50-day moving average.
Against the current backdrop, the 50-day moving average, currently 5,852, is rising toward the breakout point (5,878).
Delving deeper, the September breakout point — the 5,670 area — likely remains last-ditch support.
As always, it’s not just what the markets do, it’s how they do it.
But generally speaking, the S&P’s intermediate-term bias remains bullish barring a violation of the 5,670 area. Beyond specific levels, the prevailing backdrop sets up well for market resilience through year-end.
Also see Nov. 14: Charting bullish momentum, S&P 500 spikes to 6,000 mark.