Market bears resurface, S&P 500 fails second test of major resistance
Focus: U.S. stocks apparently not priced for aggressively surging Treasury yields as inflation persists
Technically speaking, the major U.S. benchmarks continue to whipsaw amid jagged February price action.
Against this backdrop, the S&P 500 has balked at its range top, pulling in to punctuate its second false breakout — atop the 4,545 resistance — across as many weeks
Editor’s Note: As always, updates can be directly accessed at https://chartingmarkets.substack.com.
Before detailing the U.S. markets’ wider view, the S&P 500’s hourly chart highlights the past four weeks.
As illustrated, the S&P has pulled in from its range top.
The week-to-date peak (4,590) has registered just under the February peak (4,595) to punctuate a failed retest from underneath.
Delving deeper, major support (4,495) is followed by the 200-day moving average, currently 4,452. Both areas are also detailed on the daily chart.
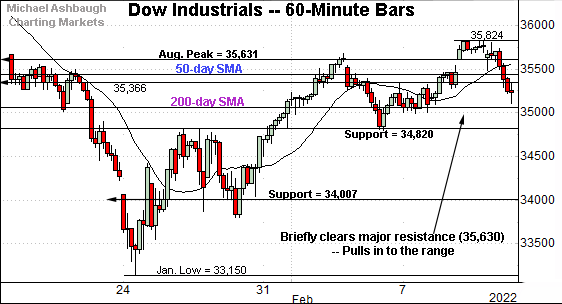
Meanwhile, the Dow Jones Industrial Average has staged a modest false breakout.
Tactically, major resistance matches the August peak (35,631). Two recent inflection points have matched resistance:
Last week’s closing high (35,629).
Thursday’s open (35,631), a level also defining a very small gap.
The prevailing pullback places the Dow’s 200-day moving average, currently 35,042, within view.
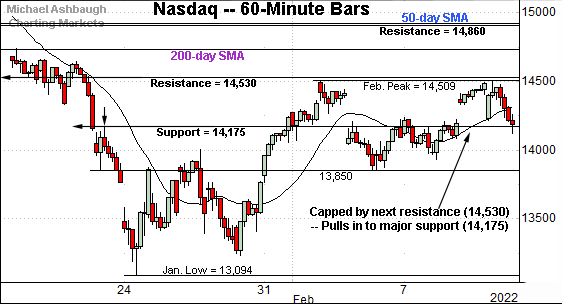
True to recent form, the Nasdaq Composite remains the weakest major benchmark.
Tactically, the index has stalled under major resistance (14,530), an area also illustrated below.
More immediately, the prevailing pullback places major support (14,175) back in play. Thursday’s close (14,185) registered slightly above support to punctuate a 305-point single-day downdraft.
(On a granular note, the S&P 500 has topped this week five points under the early-February peak. The Nasdaq has topped this week five points above the early-February peak. Both benchmarks have effectively tagged the three-week range top, and selling pressure has surfaced.)
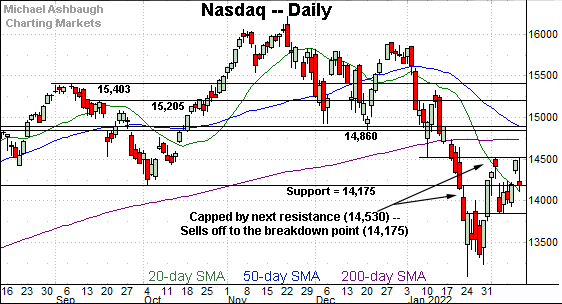
Widening the view to six months adds perspective.
On this wider view, the Nasdaq has tagged two technical levels across as many sessions.
The week-to-date peak (14,509) has registered slightly under major resistance (14,530). (Also see the hourly chart.)
The subsequent aggressive downdraft — a 305-point, 2.10% single-day plunge — has been punctuated by Thursday’s close (14,185) just above the Nasdaq’s breakdown point (14,175).
Slightly more broadly, the Nasdaq has registered two failed tests of the 14,530 area, a bull-bear inflection point, detailed previously. Both tests have been punctuated by pronounced pullbacks from resistance.
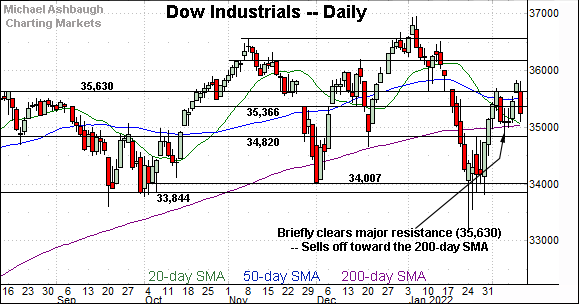
Looking elsewhere, the Dow Jones Industrial Average has whipsawed amid its February recovery attempt.
The Dow is only major benchmark to at least briefly venture atop the early-February peak.
Still, Thursday’s immediate reversal under major resistance (35,630) — via a 526-point single-day downdraft — places it back within the former range.
(On granular note, the Nasdaq Composite and Dow industrials have both reversed from the February peak amid price action resembling a bearish island reversal at key technical levels. Though neither benchmark has satified the pattern’s true technical elements, the price action is notably bearish.)
Meanwhile, the S&P 500 has whipsawed in recent sessions amid lingering volatility.
Tactically, the February range is defined by the 200-day moving average, currently 4,452, and the February peak (4,595).
The bigger picture
As detailed above, the major U.S. benchmarks continue to whipsaw amid jagged February price action.
Amid the cross currents, each benchmark has stabilized on a relative basis, asserting a comparably tighter February range versus the prior month. Still, relative basis may be the operative phrase for now.
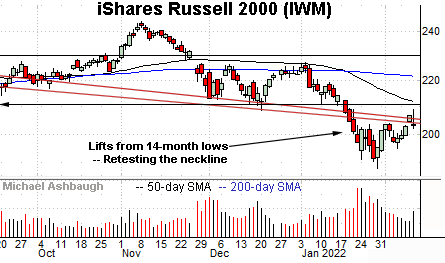
Moving to the small-caps, the iShares Russell 2000 ETF continues to lag behind the major U.S. benchmarks.
Tactically, its rally attempt has thus far stalled near the neckline of its head-and-shoulders top. See Thursday’s strong-volume downturn to punctuate a bearish single-day reversal.
More distant overhead matches the breakdown point, an area broadly spanning from 208.75 to 211.10. The 50-day moving average is descending toward resistance.
Meanwhile, the SPDR S&P MidCap 400 ETF remains comparably stronger, rising to reclaim its breakdown point (477.50).
Still, the MDY has stalled near the cross section of its 50- and 200-day moving averages.
To reiterate, eventual follow-through atop the major moving averages — the 497.50 area — would strengthen the bull case.
Returning to the S&P 500, this next chart is a weekly view, spanning 30 months. Each bar on the chart represents one week.
As illustrated, the S&P has whipsawed in the wake of an aggressive downdraft from its record high (4,818), established Jan. 4, 2022.
The initial downturn spanned as much as 470 points, or 9.8%, on a closing basis, nearly reaching the 10% correction milestone.
Against this backdrop, the S&P 500 has struggled to reclaim the 4,545 resistance.
Returning to the S&P 500’s daily chart, the index has asserted a February range.
Within the range, the S&P has failed to sustain a break atop the 4,545 resistance.
In fact, both February closes atop the 4,545 mark have been punctuated by pronounced single-day downdrafts. A 2.4% single-day plunge on Feb. 3, and Thursday’s 1.8% single-day downdraft.
Generally speaking, the major U.S. stock benchmarks do not register 2.0% single-day moves amid healthy market conditions. Moves on this order are reserved for the emerging markets.
Against this backdrop, an unusually aggressive intermediate-term downtrend continues to clash with the more important longer-term uptrend.
As always, it’s not just what the markets do,it’s how they do it.
But broadly speaking, the S&P 500’s recovery attempt is intact, and its longer-term bias remains bullish barring a violation of the 4,430-to-4,450 area.
Revisiting the Treasury yield backdrop
Concluding with one stray note, Wednesday’s review emphasized that the major U.S. stock benchmarks have rallied this month even amid recently surging Treasury yields. The tandem surge — both stocks and yields — ostensibly presented a bullish backdrop for stocks, signaling the market may have priced for rising interest rates.
This point actually made it’s way into Wednesday’s headline, with phraseology that would certainly not win any headline-writing awards. (Charting a bullish-leaning tilt, S&P 500 extends rally attempt even as Treasury yields spike.)
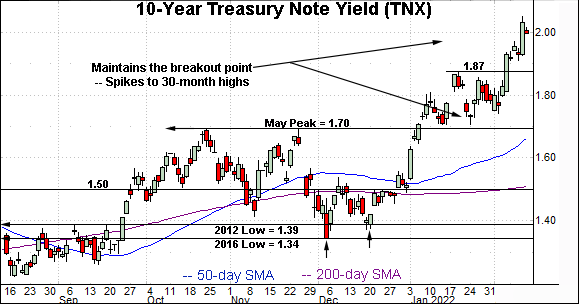
But fast forward just one day, and U.S. stocks did not respond well to the yield’s surge atop the marquee 2.00 mark.
The yield’s latest leg higher registered after a report signaling January consumer prices once again rose at their highest annual pace since 1982 — exactly 40 years ago.
The hotter-than-expected inflation data stirred concerns the Federal Reserve could raise interest rates by a half-point at its March meeting rather than the customary, and formerly expected, quarter-point hike.
In response, U.S. stocks sold off sharply: The Dow industrials dropped 526 points (1.47%.), the Nasdaq Composite plunged 305 points (2.10%) and the S&P 500 lost 83 points (1.81%.).
So the late-week price action — the interplay between stocks and yields — underscores that the pace of rising yields remains an overhang for U.S. stocks.
The major benchmarks are not priced for aggressively rising yields, or a disorderly surge.
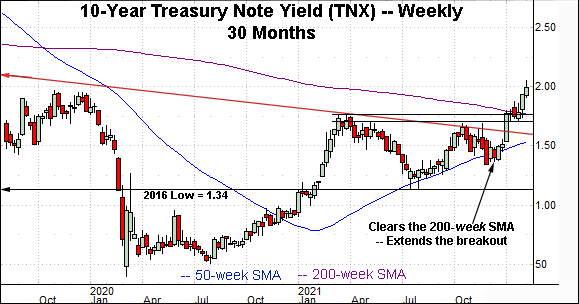
Against this backdrop, the yield has tagged a 30-month high this week (2.05), its highest level since July 2019.
As detailed previously, the prevailing early-2022 surge resembles the strong 2021 start, a move that would ultimately span 75 basis points across about 10 weeks.
The yield’s 2022 upturn has spanned 54 basis points, across six weeks, against an inflation backdrop that arguably calls for a more aggressive rise versus last year’s.
No new setups today.
Editor’s Note: The next review will be published Wednedsday.


