Cracks surface in the bull trend, S&P 500 ventures under major support
Focus: Nasdaq violates major support, Dow industrials whipsaw at 200-day average
U.S. stocks are lower mid-day Friday — though off the session’s worst levels — pressured as markets assess conflicting economic reports, and their potential influence on pending monetary policy actions.
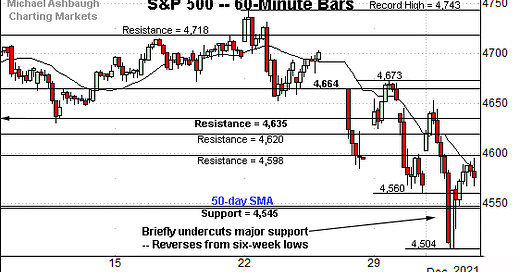
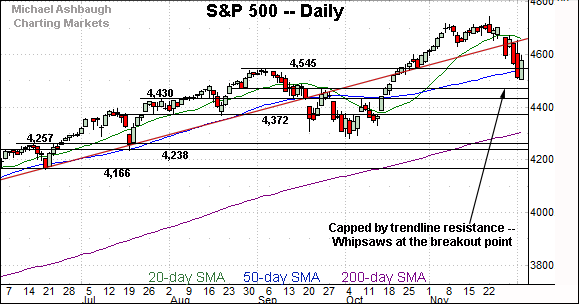
Against this backdrop, the S&P 500 has ventured under major support — S&P 4,545 — a key bull-bear inflection point currently matching the 50-day moving average.
Editor’s Note: As always, updates can be directly accessed at chartingmarkets.substack.com.
Before detailing the U.S. markets’ wider view, the S&P 500’s hourly chart highlights the past four weeks.
As illustrated, the S&P is off to a bearish December start.
The index has whipsawed at major support — the 4,545 area — briefly tagging six-week lows.
From current levels, initial resistance (4,598) is followed by the S&P’s breakdown point — the 4,620-to-4,635 area.
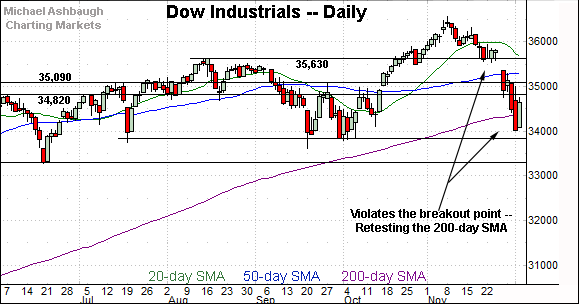
Meanwhile, the Dow Jones Industrial Average remains the weakest major benchmark.
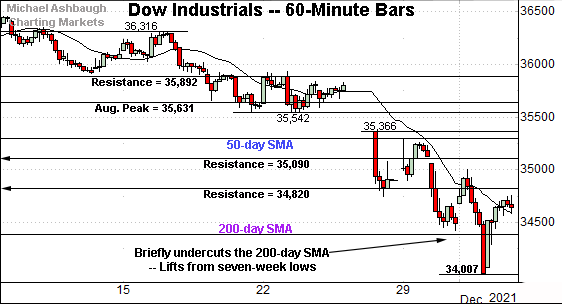
In its case, the index whipsawed at its 200-day moving average, currently 34,392, briefly tagging seven-week lows.
This marks the Dow’s first venture materially under the 200-day moving average since July 2020.
Tactically, the 34,820 resistance remains a bull-bear inflection point.
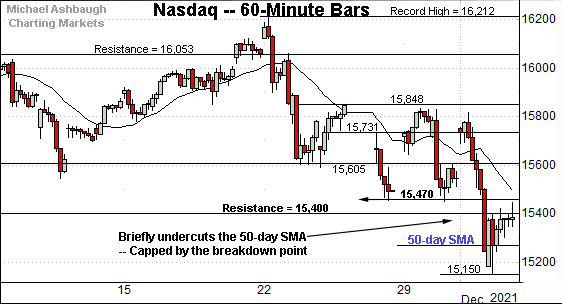
Against this backdrop, the Nasdaq Composite is also off to a shaky December start.
As illustrated, the index has violated its breakout point — the 15,400 area — and subsequently observed this area as resistance.
An extended retest of the 50-day moving average, currently 15,278, remains underway.
(On a granular note, the early-November low (15,470) rests slightly overhead, an inflection point detailed repeatedly. Friday’s early session high (15,470) has precisely matched resistance.)
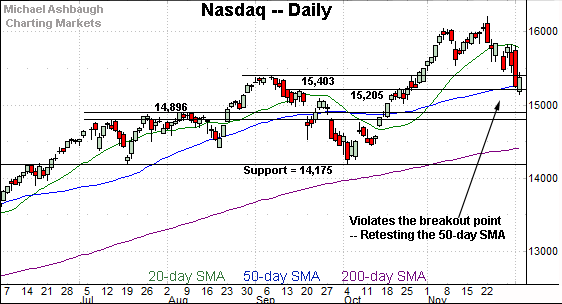
Widening the view to six months adds perspective.
On this wider view, the Nasdaq has pulled in aggressively from its recent record high.
In the process, the index has violated its breakout point (15,403), an area marking its first significant support.
The relatively swift violation of this area — on the first approach — should raise eyebrows.
Delving deeper, the 50-day moving average, currently 15,278, is followed by the former range top (15,205). The Nasdaq’s bullish intermediate-term bias gets the benefit of the doubt barring a violation of this area.
Looking elsewhere, the Dow Jones Industrial Average has pulled in to a truly headline technical test.
Specifically, the index is testing its 200-day moving average, currently 34,392.
As always, the 200-day moving average is a widely-tracked longer-term trending indicator.
The Dow has not closed under its 200-day since July 2020, a stretch spanning 16 months. So potentially consequential price action is currently in play.
Beyond technical levels, the Dow’s intermediate-term bias remains bearish based on today’s backdrop.
Tactically, a sustained reversal above the Dow’s former range top (34,820) would place the brakes on bearish momentum.
Meanwhile, the S&P 500 remains stronger than the Dow industrials, though an inauspicous December start is underway.
Tactically, a volatile retest of the breakout point (4,545) remains in play. The S&P’s 50-day moving average, also 4,545, currently matches the breakout point.
Slightly more broady, the December downturn punctuates a failed test of the S&P’s trendline from underneath.
The bigger picture
As detailed above, the major U.S. benchmarks are off to a bearish December start.
On a headline basis, the Dow Jones Industrial Average has whipsawed at its 200-day moving average, briefly venturing lower for the first time since July 2020.
Meanwhile, the Nasdaq Composite has violated its breakout point (15,400) and subsequently observed this area as resistance. (See the hourly chart.)
Against this backdrop, the S&P 500 has whipsawed at major support (4,545) a level currently matching its 50-day moving average.
Combined, these are consequential technical tests, and the response to each area — potentially across the next several sessions — may contribute to setting the year-end tone.
Moving to the small-caps, the iShares Russell 2000 ETF has violated major support, pressured amid a sustained volume spike.
Moreover, the small-cap benchmark has failed its initial test of the 200-day moving average, currently 224.40, from underneath.
Combined, the immediate violation of the 200-day — on the first approach — and subsequent failed retest from underneath, suggests market bears are setting the tone.
Tactically, a sustained reversal atop the 200-day moving average would mark a step toward stabilization.
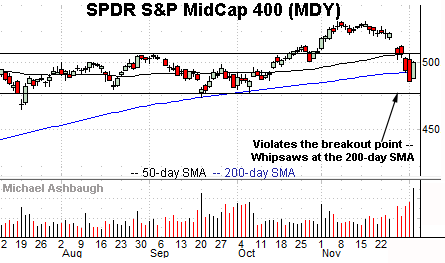
Meanwhile, the SPDR S&P MidCap 400 ETF has registered similar price action in one key respect.
Namely, the MDY has violated its breakout point, circa 506.00, and subsequently failed the initial retest from underneath.
Slightly more broadly, an extended test of the 200-day moving average, currently 492.80, remains underway.
Consider that Wednesday’s close marked the MDY’s first close under its 200-day moving average since September 2020.
Market breadth remains a concern
Returning to market breadth, the prevailing downturn exhibits unsettling traits.
Recall last Friday’s virus-fueled downdraft registered 9-to-1 NYSE negative breadth. (Declining volume surpassed advancing volume by a 9-to-1 margin.)
Fast forward to this week, and Tuesday’s Fed-fueled downdraft induced comparable selling pressure.
Specifically, NYSE declining volume surpassed advancing by a greater than 8-to-1 margin. (Nasdaq selling pressure registered as comparably tame, about 2-to-1 negative breadth in both cases.)
As always, in a textbook world, two 9-to-1 down days — across about a seven-session window — would reliably signal a material trend shift.
So by this metric, the NYSE has registered two nearly 9-to-1 down days across a narrow three-session window.
To be sure, last week’s 9-to-1 down day carried an asterisk, as detailed previously. It registered amid a half-session, the day after Thanksgiving. (The markets were open last Friday to satisfy a U.S. regulation that the markets cannot be closed for more than three consecutive days.)
Still, the subsequent price action — following two 9-to-1 down days — raises a genuine caution flag.
For instance, the S&P 500 has failed a test of its trendline from underneath, the Nasdaq Composite has failed a test of its breakdown point (15,400) from underneath, and the Russell 2000 has failed a test of its 200-day moving average from underneath.
Take the textbook bearish internals — add the subsequent price action — and a potentially treacherous backdrop begins to emerge.
Returning to market sentiment, the Volatility Index (VIX) — a widely-tracked market-fear gauge — has taken flight.
As always, extreme VIX highs signal excessive fear, consistent with durable S&P 500 lows.
Conversely, extreme VIX lows signal investor complacency, consistent with S&P 500 tops.
Against the current backdrop, the Volatility Index has tagged 10-month highs. Wednesday’s close marked the year’s third-highest close, and the highest close since January.
But here again, market bears will contend the S&P 500 has registered a “lower low” — for a second time amid the current market downturn — while the VIX did not register a corresponding “higher high.”
The VIX can, and under the right circumstances will, extend firmly higher as illustrated on the 30-year chart.
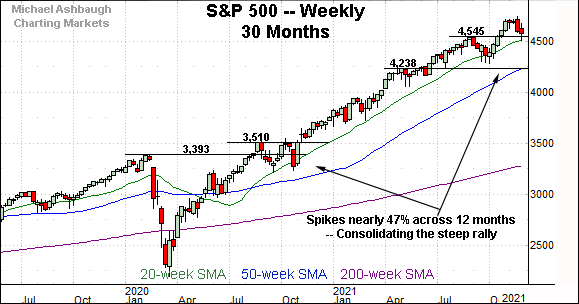
More broadly, the S&P 500 is digesting a massive 12-month, 46.6% rally from the November 2020 low — (just before the U.S. election) — to the November 2021 peak.
The latest consolidation phase is underway, amid a market that is up on a stilt.
Collectively, the recent market internals raise a caution flag, and market sentiment, as measured by the Volatility Index, is currently equivocal.
Against this backdrop, the market price action, as always, trumps other indicators.
In this case, the S&P 500’s backdrop remains relatively straightforward.
To start, the prevailing downturn has been punctuated by a failed test of trendline resistance from underneath. Shaky price action.
More immediately, a volatile retest of the breakout point (4,545) — a key bull-bear inflection point, detailed repeatedly — remains underway.
As always, it’s not just what the markets do, it’s how they do it. (The markets have not been acting well over the prior five sessions.)
But generally speaking, a closing violation of the 4,545 area would raise the flag to an intermediate-term trend shift. The weekly close, and the next several sessions, will likely add color.

