Charting the S&P 500's precarious backdrop as currency trends accelerate
Focus: Prevailing currency trends accelerate, U.S. dollar takes flight as Japanese yen and euro extend downtrends
Technically speaking, the major U.S. benchmarks continue to whipsaw amid jagged, and still largely bearish, 2022 price action.
Amid the cross currents, the S&P 500 is vying to maintain major support (4,170), a potentially consequential bull-bear inflection point. The charts below add color:
Editor’s Note: As always, updates can be directly accessed at https://chartingmarkets.substack.com.
Before detailing the U.S. markets’ wider view, the S&P 500’s hourly chart highlights the past four weeks.
As illustrated, the S&P is vying to rally from its range bottom.
The prevailing upturn punctuates a successful test of major support (4,170), an area better illustrated on the daily chart.
More broadly, the initial rally attempt has registered as comparably flat versus the aggressive downturn from the 200-day moving average. Bearish price action.
Meanwhile, the Nasdaq Composite has rallied from 13-month lows.
(Editor’s note: Today’s format has been adjusted to expand on currency trends in the next section.)
Here again, the initial upturn registers as flattish versus the prior downdraft from resistance.
Widening the view to six months adds perspective.
On this wider view, the Nasdaq has tagged 13-month lows, placing distance under its 50-day moving average.
Tactically, the former range bottom (12,555) remains an inflection point.
More broadly, the Nasdaq’s former breakdown point (13,350) marks more distant resistance. Eventual follow-through atop this area would mark a step toward stabilization.
The initial retest of the 13,350 area would be expected to draw selling pressure, based on today’s backdrop.
Meanwhile, the S&P 500 has maintained major support (4,170) an area detailed repeatedly.
The April closing low (4,175) — established Tuesday — registered nearby to punctuate a successful retest.
More broadly, the preceding downdraft — the sharp sell-off from the 200-day moving average — was fueled by unusually aggressive selling pressure.
Recall the downturn encompassed two 7-to-1 down days across a narrow three-session span. (Declining volume surpassed advancing volume by a 7-to-1 margin.)
By comparison, the initial rally from support (4,170) — an otherwise strong 2.5% daily gain — registered comparably tame internals, on the order of 4-to-1 positive breadth.
More plainly, bearish momentum continues to dictate the technical tone, based on today’s backdrop. (See Wednesday’s review for added detail on the internals.)
Widening the S&P 500’s view, this next chart spans 30 months. Each bar on the chart represents one week.
As illustrated, the S&P has initially maintained major support (4,170), a familiar area, detailed previously. (See for instance, the April 5 review.)
Still, the downdraft to support has been aggressive, and punctuated by an initially lukewarm defense of support.
More broadly, the prevailing downturn punctuates a developing head-and-shoulders top, defined by the September, January and March peaks. As always, the head-and-shoulders top is a high-reliability bearish reversal pattern.
As detailed previously, a downside target projects to the 3,800 area on a violation of the range bottom.
(Start with 4,545 - 4,170 = 375 points. Then, subtract the result from the breakdown point: 4,170 - 375 = 3,795.)
So tactically, the S&P 500’s retest of the 4,170 area — potentially across the next several sessions — remains a “watch out.” Beyond near-term issues, the S&P 500’s longer-term trends remain bearish pending repairs.
Watch List — Prevailing currency trends accelerate
Drilling down further, likely consequential currency trends accelerated to conclude April. The charts below exemplify the backdrop:
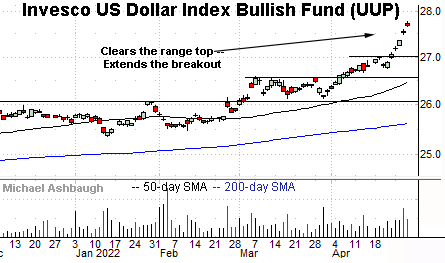
To start, the Invesco U.S. Dollar Bullish Fund (UUP) — a U.S. dollar proxy — has taken flight.
The persistent April upturn punctuates an orderly March range, and dovetails with the S&P 500’s corresponding downturn.
The Federal Reserve’s hawkish policy tilt has contributed to recent dollar strength. Very generally, higher interest rates make a native currency (in this case the dollar) more attractive versus competing currencies, sending it higher.
More broadly, the shares have cleared a 14-year range top — illustrated on the monthly chart — opening the path to potentially material upside follow-through.
Conversely, the Invesco CurrencyShares Japanese Yen (FXY) has extended a downtrend.
Yen weakness has been fueled at least partly by the Bank of Japan’s dovish policy versus other central banks. Japan has experienced unusually low inflation coming out of the pandemic, contributing to its policy stance.
More broadly, the shares have violated a 14-year range bottom, illustrated on the monthly chart. The downturn has accelerated over the prior two months.
Similarly, the Invesco Currency Shares Euro Trust (FXE) has extended to record lows.
The downturn punctuates consecutive failed tests of the breakdown point. (See the arrows.)
More broadly, the breakdown punctuates a massive euro downtrend, hinged to the 2008 peak. (See the monthly chart.)
Finally, the Invesco CurrencyShares Swiss Franc (FXF) has also turned lower, pressured amid an April downdraft.
Elsewhere, China’s offshore yuan is not illustrated, though the currency is pacing its worst month versus the U.S. dollar on record.
Collectively, it’s not just a trend’s direction, it’s also the rate of change that matters. The prevailing currency trends likely present a global-market headwind pending signs of stabilization.
Editor’s Note: The next review will be published Tuesday.


