Charting technical question marks, S&P 500 reclaims key levels
Focus: Brazil's trendline breakout, Energy sectors continue to outperform, Ciena pulls in from 19-year highs, XLE, XOP, EWZ, ADM, CIEN
Technically speaking, the major U.S. benchmarks have extended a rally from multi-month lows, rising amid a guardedly constructive February start.
In the process, the S&P 500 has reclaimed several key technical levels — including its 200-day moving average — though the prevailing rally attempt gets mixed marks for style when placed in the 2022 market context.
Editor’s Note: As always, updates can be directly accessed at https://chartingmarkets.substack.com. (Experimenting with a new layout on the Charting Markets main page.)
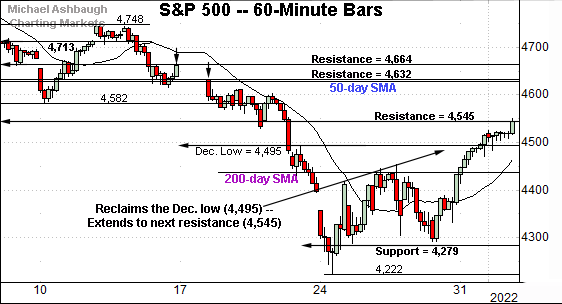
Before detailing the U.S. markets’ wider view, the S&P 500’s hourly chart highlights the past four weeks.
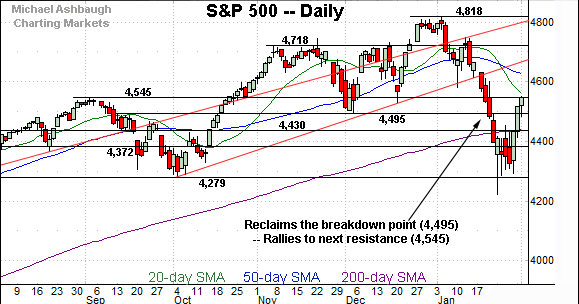
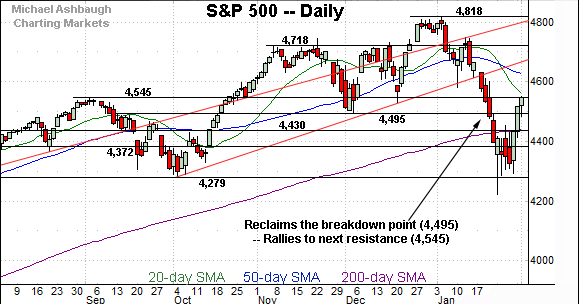
As illustrated, the S&P has reclaimed its 200-day moving average, currently 4,440, as well as resistance matching the December low (4,495).
The subsequent follow-through places next resistance (4,545) under siege. Each area is also detailed on the daily chart.
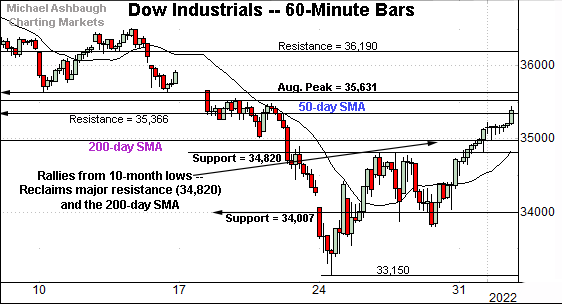
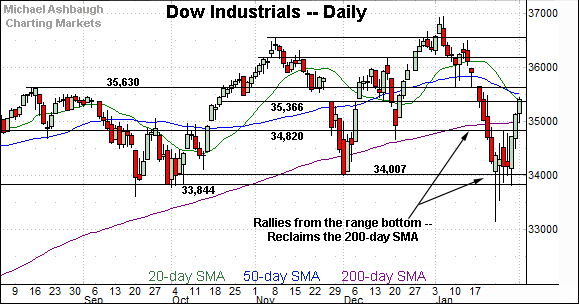
Meanwhile, the Dow Jones Industrial Average has extended a rally from 10-month lows.
In the process, the index has reclaimed major resistance (34,820), and the 200-day moving average, currently 34,995.
Recent strength places the 50-day moving average, currently 35,516, firmly within view.
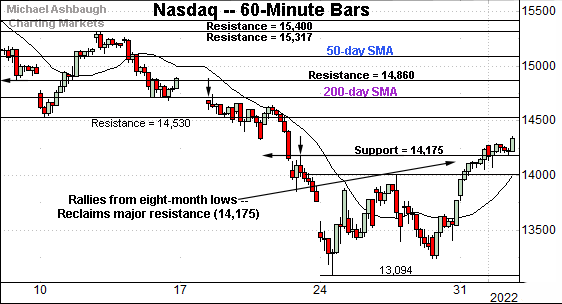
True to recent form, the Nasdaq Composite remains comparably weaker than the other major benchmarks.
Nonetheless, the index has reclaimed its breakdown point (14,175), an area matching major resistance better illustrated below.
More distant overhead matches the early-January low (14,530).
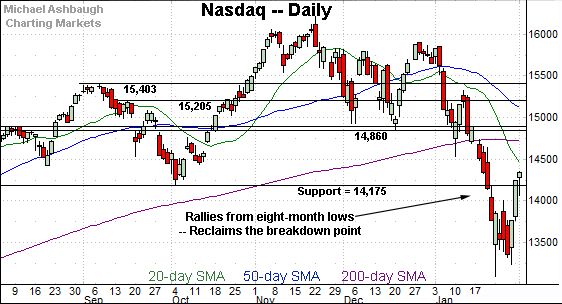
Widening the view to six months adds perspective.
On this wider view, the Nasdaq has reclaimed its breakdown point (14,175), notching consecutive closes higher.
The breakdown point matches the February 2021 peak (14,175), the July low (14,178) and the October low (14,181).
Put differently, this area “should have” drawn selling pressure if a strong downtrend were in play. The relatively swift reversal higher — on the first retest from underneath — raises a question mark.
Tactically, the Nasdaq’s near-term recovery attempt is intact barring a re-violation of the breakdown point (14,175).
On further strength, the 200-day moving average, currently 14,733, remains relatively distant.
Beyond the prevailing bounce, the Nasdaq’s intermediate- to longer-term bias remains bearish based on today’s backdrop. The quality of the prevailing rally attempt will continue to add color.
Looking elsewhere, the Dow Jones Industrial Average has rallied from its range bottom.
To reiterate, the sharp upturn places the index back atop major resistance (34,820), an area matching last week’s high (34,815).
Perhaps more notably, the Dow’s rally attempt has been punctuated by consecutive closes atop the 200-day moving average, currently 34,995.
Meanwhile, the S&P 500 has knifed from seven-month lows.
The prevailing upturn has been punctuated by consecutive closes atop its breakdown point (4,495), a level partly defining the S&P’s double top. Recall the “M” formation, defined by the November and January peaks.
More immediately, Tuesday’s close (4,546) matched next resistance (4,545), a level defining the October breakout point. An extended retest remains underway.
The bigger picture
As detailed above, the major U.S. benchmarks have rallied respectably from recent multi-month lows.
In the process, each index has reclaimed key technical levels amid a bigger-picture backdrop that remains conflicted.
Specific areas include S&P 4,495, Nasdaq 14,175, and the Dow’s 200-day moving average.
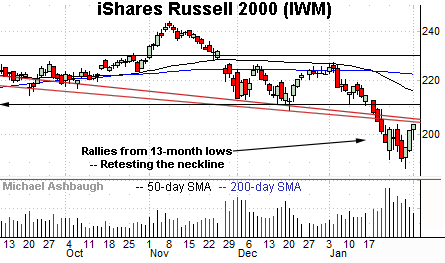
Moving to the small-caps, the iShares Russell 2000 ETF has reversed from 13-month lows.
The prevailing upturn has been capped by the post-breakdown peak (203.55), detailed previously.
Tuesday’s session high (203.57) registered nearby.
Tactically, upside follow-through atop the neckline, and the breakdown point (211.10) would place the shares on firmer technical ground.
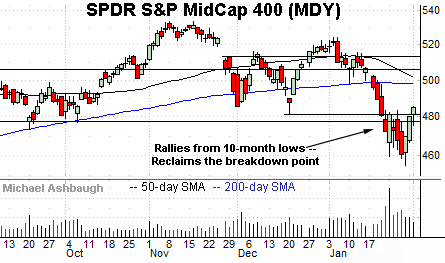
Meanwhile, the SPDR S&P MidCap 400 ETF has rallied from 10-month lows.
The prevailing upturn places it back atop the breakdown point (477.50) — and the December low (481.50) — areas that pivot to support.
Combined, the small- and mid-cap benchmarks have rallied amid decreased volume.
Beyond the charts — Price action remains a question mark
Beyond the charts, the 2022 price action has registered as distinctly unusual.
On a positive note, respectable bullish momentum surfaced on Jan. 31, to conclude an otherwise ugly month.
For instance, advancing volume surpassed declining volume by a 4.5-to-1 margin on the NYSE, and a much stronger 10-to-1 margin on the Nasdaq.
That strong single-day rally placed the S&P 500 and Nasdaq Composite atop key bull-bear inflection points, detailed repeatedly — S&P 4,495 and Nasdaq 14,175.
This means each index reclaimed major resistance fueled by bullish internal strength ranging from firmly respectable (S&P 500) to nearly off-the-charts extreme (Nasdaq).
In a textbook world, price action on this order would not register if a powerful downtrend (or pending crash) were in play.
But against this backdrop, the January downdraft’s aggressiveness remains a lingering overhang. The selling pressure registered milestones not experienced since the 1980’s and 1990’s in spots.
Among the nearly-historic bearish milestones: The collective selling pressure registered during each January session’s final hour. (A market adage is that market professionals control each session’s final hour, and retail investors influence the first hour.)
With this as context, the prevailing market upturn — the S&P 500’s respectable rally atop its breakdown point (4,495) — has registered amid three straight final-hour volume spikes.
Much of the market’s upside has been achieved across just three hours, the final hour to conclude January’s last two sessions, and February’s first session.
Cast in this light, market bears might contend the recent aggressive market spike looks less constructive, and instead, could be characterized as simply unstable price action.
Time will tell. It may be that the S&P 500’s a fragile longer-term backdrop holds together to the extent markets price for a less-hawkish Federal Reserve than previously feared.
Returning to the S&P 500’s daily chart, the index has knifed from its range bottom after briefly tagging seven-month lows.
Tactically, the prevailing upturn places the index firmly back atop its 200-day moving average.
Separately, the S&P has also registered consecutive closes atop its breakdown point (4,495), a headline inflection point, detailed repeatedly. (Recall the double top, defined by the November and January peaks, and the breakdown point (4,495).)
More immediately, the S&P has rallied to next resistance (4,545), a level defining the October breakout point. Tuesday’s close (4,546) matched resistance, and the index has extended its rally attempt mid-day Wednesday.
Beyond specific levels, the prevailing backdrop marks the S&P 500’s least straightforward backdrop over at least the past year. This is not easy to get down in words.
But broadly speaking, the S&P 500’s bullish longer-term bias — and its prevailing near-term recovery attempt — are intact barring a violation of the 4,430 area.
Watch List
Drilling down further, the Energy Select Sector SPDR continues to outpace the broad markets. (Yield = 3.9%.)
As illustrated, the group has recently maintained major support (59.40), rising to tag 33-month highs.
Tactically, a sustained posture atop the breakout point, circa 65.50, signals a firmly-bullish bias.
Fundamentally, crude oil prices are holding near seven-year highs, largely treading water Wednesday after OPEC nations effectively agreed to hold production steady.
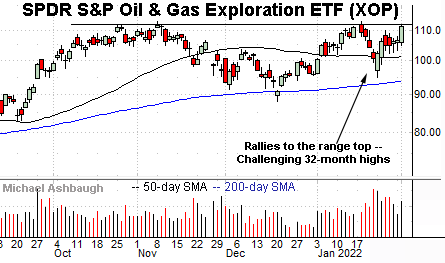
Meanwhile, the SPDR S&P Oil & Gas Exploration ETF is showing signs of life, rising to challenge 32-month highs.
Tactically, near-term support (104.90) is closely followed by the 50-day moving average. A breakout attempt is in play barring a violation.
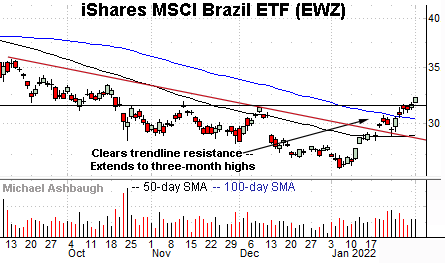
Elsewhere, the iShares MSCI Brazil ETF is acting well technically.
As illustrated, the shares have extended a recent trendline breakout, reaching three-month highs.
Tactically, the breakout point (31.30) is followed by the 100-day moving average. The prevailing rally attempt is intact barring a violation.
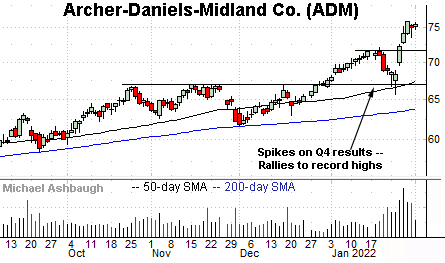
Archers-Daniels-Midland Co. is a large-cap agricultural commodities merchant. (Yield = 2.1%.)
Late last month, the shares knifed to all-time highs, rising after the company posted strong quarterly results, and increased its dividend. The prevailing upturn originates from the former range top (67.00).
From current levels, the post-breakout low (73.60) is followed by the firmer breakout point (71.50). A posture higher signals a firmly-bullish bias.
Finally, Ciena Corp. is a well positioned large-cap networking name.
The shares initially spiked two months ago, gapping to 19-year highs after the company’s strong fourth-quarter results.
The subsequent pullback has filled the gap, placing the shares 18.4% under the December peak.
Tactically, the 62.25-to-63.00 area offers an area to work against. A sustained posture higher signals a bullish bias.
More broadly, the shares are also very well positioned on the two-year chart.


