Charting a bullish reversal, S&P 500 reclaims 200-day average
Focus: Despite rally's directional strength, other metrics (including breadth) remain a concern
Technically speaking, the major U.S. benchmarks have rallied respectably from multi-month lows, rising in the wake of otherwise damaging January price action.
Against this backdrop, the S&P 500 has ventured back atop its 200-day moving average, rising within striking distance of more important resistance at its breakdown point (4,495). The pending retest from underneath should be a useful bull-bear gauge.
Editor’s Note: As always, updates can be directly accessed at https://chartingmarkets.substack.com. (Experimenting with a new layout on the Charting Markets main page.)
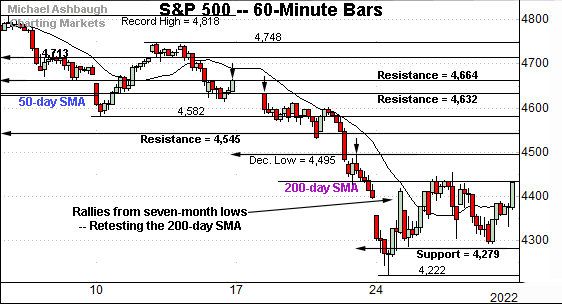
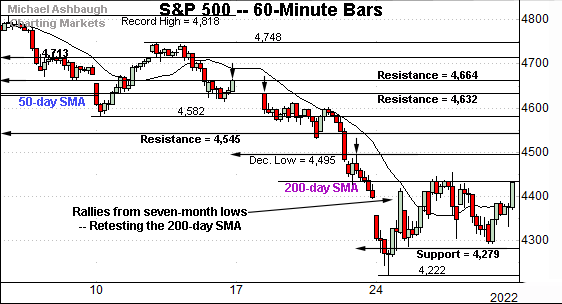
Before detailing the U.S. markets’ wider view, the S&P 500’s hourly chart highlights the past four weeks.
As illustrated, the S&P has rallied to retest its 200-day moving average, currently 4,436.
Last week’s close (4,432) registered slightly under the 200-day, and the index has extended its rally attempt early Monday.
On further strength, significant resistance matches the December low (4,495).
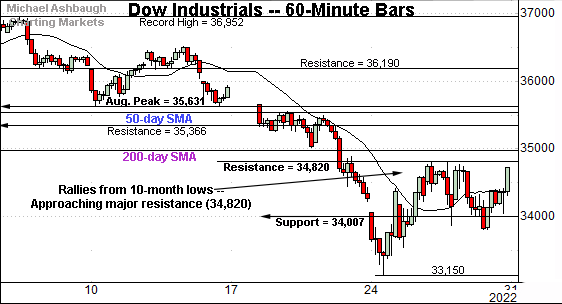
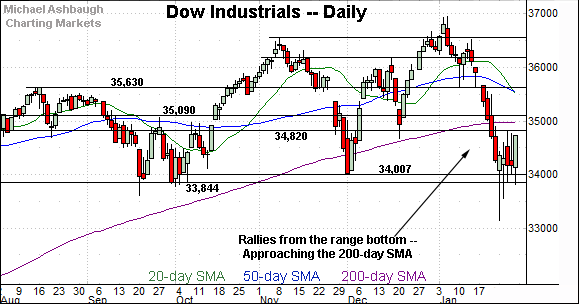
Meanwhile, the Dow Jones Industrial Average is rising from 10-month lows.
Tactically, its rally attempt has thus far been capped by major resistance (34,820), an area also illustrated on the daily chart.
Last week’s high (34,815) registered nearby.
On further strength, the 200-day moving average, currently 34,979, remains slightly more distant.
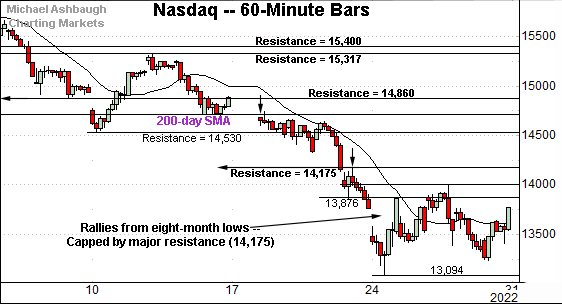
Perhaps not surprisingly, the Nasdaq Composite remains the weakest major benchmark.
Nonetheless, the index has reversed from eight-month lows.
Tactically, the post-breakdown peak (14,002) is followed by major resistance (14,175), an area better illustrated on the daily chart below.
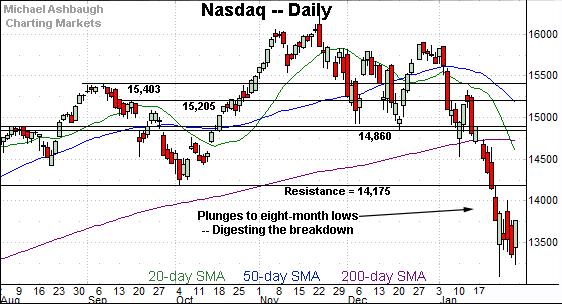
Widening the view to six months adds perspective.
On this wider view, the Nasdaq continues to digest a January technical breakdown.
Recall selling pressure accelerated amid its violation of the 200-day moving average, currently 14,727.
More immediately, the index is vying to rally from eight-month lows.
To reiterate, the post-breakdown peak (14,002) is followed by major resistance at the breakdown point (14,175). An eventual close higher would mark a notable step toward stabilization.
Looking elsewhere, the Dow Jones Industrial Average has rallied from its range bottom.
Tactically, major resistance (34,820) remains an inflection point.
Last week’s high (34,815) registered nearby to punctuate a failed retest from underneath.
Slightly more distant overhead matches the 200-day moving average, currently 34,979.
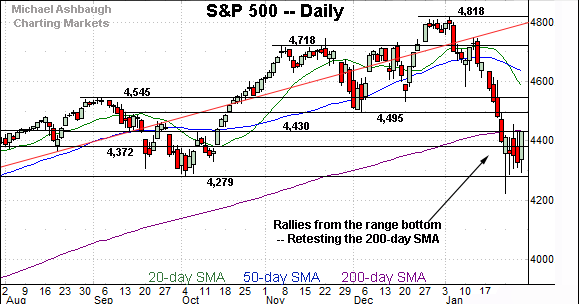
Meanwhile, the S&P 500 has reached a headline technical test.
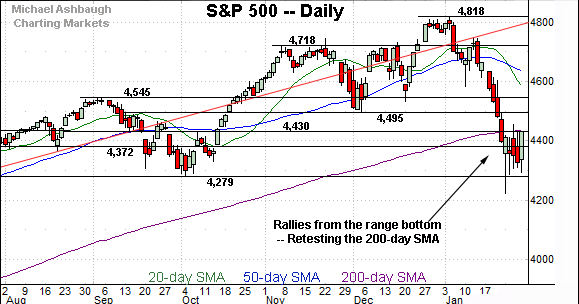
Tactically, recall that the 200-day moving average, currently 4,436, roughly matches the 4,430 resistance.
Last week’s close (4,432) matched this area to punctuate a 105-point, 2.4%, single-day gain.
The S&P has extended back atop its 200-day moving average early Monday.
The bigger picture
As detailed above, the major U.S. benchmarks have rallied respectably from multi-month lows.
Against this backdrop, each index has rallied within striking distance of a notable technical test from underneath.
Headline levels to track include Nasdaq 14,175 and S&P 4,495. (The Jan. 21 session highs matched both levels amid a failed initial retest.)
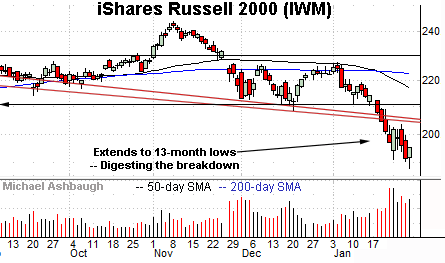
Moving to the small-caps, the iShares Russell 2000 ETF is digesting a downdraft to 13-month lows.
The recent strong-volume plunge punctuates a head-and-shoulders top defined by the September, November and January peaks.
Tactically, the post-breakdown peak (203.55) remains an overhead inflection point. An eventual close higher would mark an early step toward stabilization.
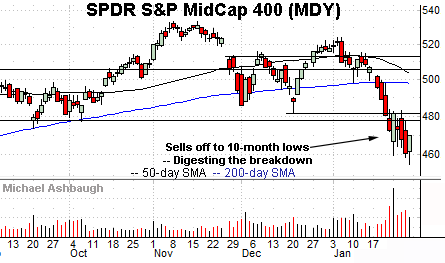
Meanwhile, the SPDR S&P MidCap 400 ETF is digesting a plunge to 10-month lows.
Tactically, the breakdown point (477.50) is followed by the December low (481.50). The pending retest from underneath should be a useful bull-bear gauge.
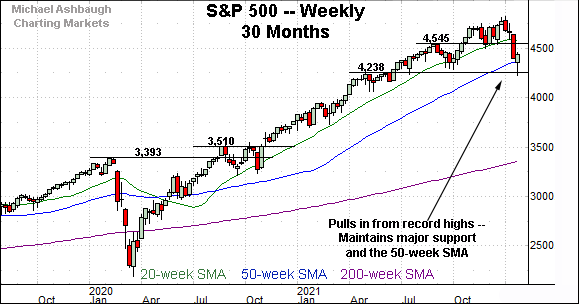
Returning to the S&P 500, this next chart is a weekly view, spanning 30 months. Each bar on the chart represents one week.
As illustrated, the S&P has pulled in sharply from its record high (4,818), established Jan. 4, 2022.
The downturn has spanned as much as 470 points, or 9.8%, on a closing basis, nearly reaching the 10% correction milestone.
Against this backdrop, the S&P has initially maintained major support (4,238) detailed previously. The January low (4,222) registered nearby.
Separately, the S&P has also maintained its 50-week moving average, currently 4,370, preserving a stretch of closes higher going back to June 2020.
Placing a finer point on the S&P 500, the hourly chart above spans just one month.
Tactically, the index has rallied to retest its 200-day moving average, currently 4,436.
Last week’s close (4,432) registered slightly under the 200-day, and the index has ventured comfortably higher early Monday.
Market breadth remains a question mark
Though Friday’s rally registered as directionally strong — amid a 105-point, 2.4%, single-day gain — the underlying internal strength left room for improvement.
For instance, NYSE advancing volume surpassed declining volume by a narrow 2.5-to-1 margin.
By comparison, the preceding downdraft encompassed a 5-to-1 down day — and a nearly 8-to-1 down day — across a narrow four-session window.
So collectively, the prevailing upturn carries the traits of a bear-market rally attempt, not a stake-in-the-ground bullish reversal. At least based on today’s backdrop.
Returning to the S&P 500’s daily chart, the index has reversed from seven-month lows.
To reiterate, the 200-day moving average, currently 4,436, roughly matches the 4,430 resistance.
Last week’s close (4,432) matched resistance, and the index is firmly higher early Monday. (Also recall Thursday’s session high (4,428) effectively matched resistance.)
Tactically, a near-term rally attempt is in play to the extent the S&P sustains its break back atop the 4,430 area.
Still, more important overhead matches the breakdown point (4,495), a level partly defining the S&P 500’s double top. (Recall the double top is defined by the November and January peaks.)
As detailed previously, the S&P 500’s backdrop supports a bearish intermediate-term bias pending a sustained reversal atop the breakdown point (4,495). The next retest from underneath should be a useful bull-bear gauge.


