Charting a slow-motion breakout: S&P 500 edges to record territory
Focus: S&P 500 and Dow industrials register two standard deviation breakouts, Nasdaq Composite stalls near familiar resistance
U.S. stocks are higher early Monday, rising modestly ahead of several influential earnings reports from large-cap technology names, due out this week.
Against this backdrop, the S&P 500 and Dow industrials continue to challenge record highs amid a slow-motion breakout attempt that remains underway.
Editor’s Note: As always, updates can be directly accessed at chartingmarkets.substack.com.
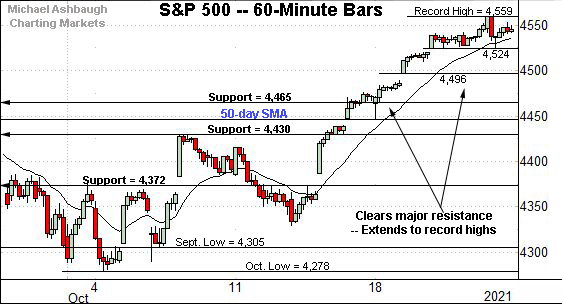
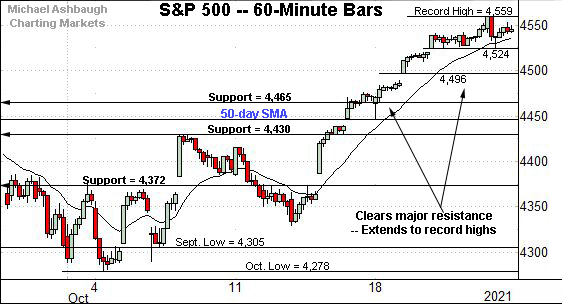
Before detailing the U.S. markets’ wider view, the S&P 500’s hourly chart highlights the past four weeks.
As illustrated, the S&P has extended its mid-October breakout, rising to register a record high.
The October peak (4,559.67) has eclipsed the S&P’s former record peak (4,545.85) by about 14 points.
Tactically, the prevailing range bottom (4,524) is followed by deeper gap support (4,496).
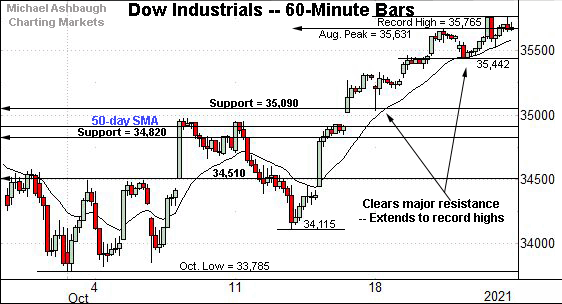
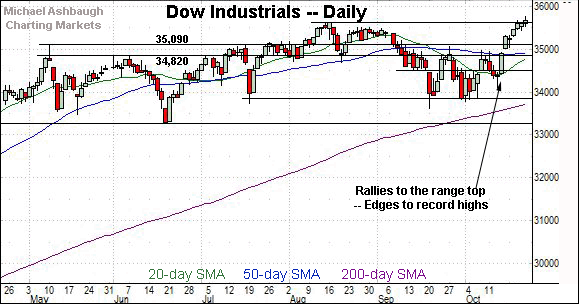
Similarly, the Dow Jones Industrial Average has tagged its latest record high.
Tactically, the August peak (35,631) — formerly the Dow’s all-time high — is followed by the prevailing range bottom (35,442).
Monday’s early session low (35,629) has closely matched the former.
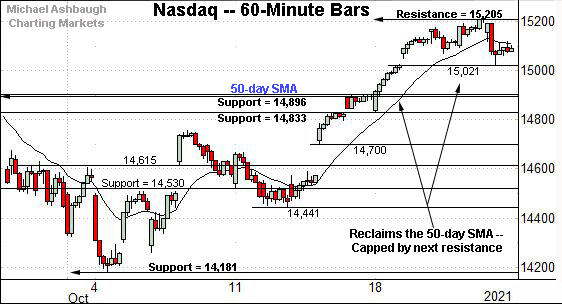
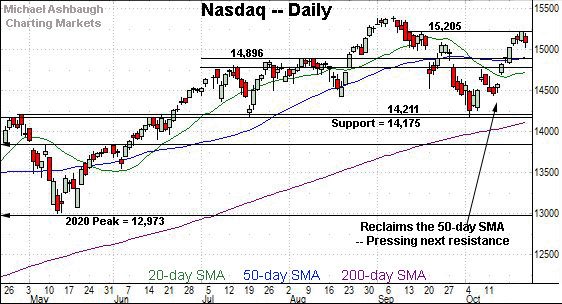
Against this backdrop, the Nasdaq Composite has not reached record territory.
Instead, the index has topped near next resistance — detailed previously — an area also illustrated on the daily chart below.
Tactically, the prevailing range bottom (15,021) is followed by the 50-day moving average, currently 14,905.
Widening the view to six months adds perspective.
On this wider view, the Nasdaq has sustained a rally atop its breakdown point (14,896) and the 50-day moving average, currently 14,905.
Recall that the prior week’s close (14,897) — (the week before last week) — matched the breakdown point (14,896).
So tactically, the 14,900 area remains a bull-bear inflection point. A sustained posture higher signals a bullish intermediate-term bias.
Conversely, the Nasdaq’s response to next resistance (15,205) is worth tracking. The initial selling pressure in this area has been muted.
Looking elsewhere, the Dow Jones Industrial Average has edged to record territory.
Tactically, the breakout point (35,631) pivots to first support.
To reiterate, Monday’s early session low (35,629) closely matched the breakout point. Constructive price action.
Delving deeper, a familiar inflection point closely matches the May peak (35,091). (Also see the hourly chart.)
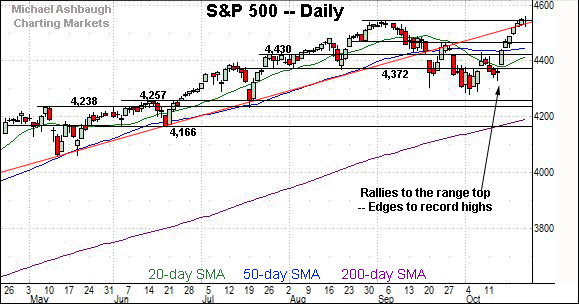
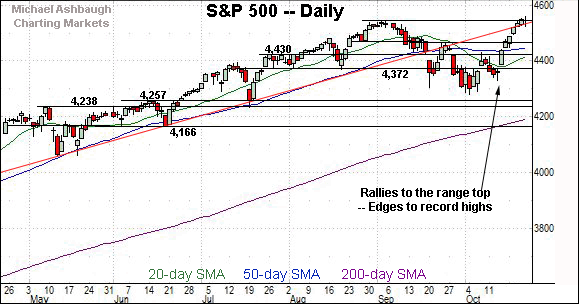
Similarly, the S&P 500 has tagged a nominal record high.
Recall last week’s high (4,559) eclipsed the September peak by about 14 points.
Slightly more broadly, the prevailing upturn has marked an unusual two standard deviation breakout, encompassing consecutive closes atop the 20-day volatility bands.
The bigger picture
As detailed above, the U.S. benchmarks are acting well technically with the best six months seasonally — November through April — just one week away.
On a headline basis, the S&P 500 and Dow industrials staged two standard deviation breakouts last week, notching consecutive closes atop the 20-day Bollinger bands. Each benchmark has followed through to tag a nominal record high.
(The Dow has registered the strongest breakout, notching three closes atop its volatility bands across a four-session window.)
Meanwhile, the Nasdaq Composite continues to lag behind, thus far stalling in the vicinity of next resistance (15,205).
Moving to the small-caps, the iShares Russell 2000 ETF remains range-bound.
Still, the prevailing upturn places a three-month range top (229.84) — detailed previously — just overhead.
Monday’s early session high (229.64) registered within view.
Tactically, eventual follow-through atop resistance would punctuate a bullish double bottom.
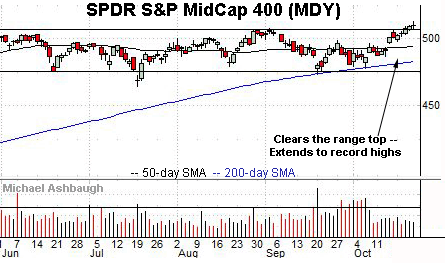
Meanwhile, the SPDR S&P MidCap 400 ETF has edged to record territory.
The prevailing upturn punctuates a prolonged five-month base, laying the groundwork for potentially material upside follow-through. (The longer the base, the higher the space.)
Tactically, the breakout point — the 506.00-to-507.60 area — pivots to support.
(Also recall the prevailing upturn originates from the 200-day moving average at the October low.)
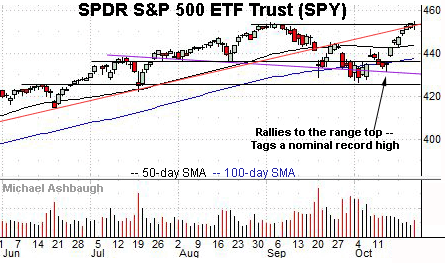
Looking elsewhere, the SPDR Trust S&P 500 ETF has also tagged record highs, though more narrowly.
Consider that the prevailing range top closely matches trendline resistance. Selling pressure in this area has thus far been muted.
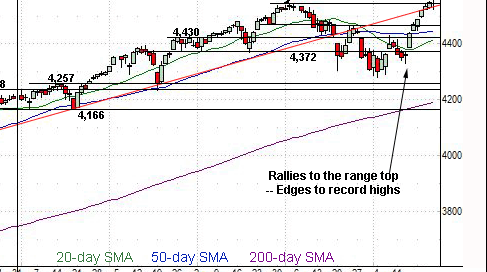
Placing a finer point on the S&P 500, the index has extended its mid-October breakout, tagging record highs.
Tactically, the prevailing range bottom (4,524) is followed by deeper gap support (4,496).
More broadly, the S&P 500 has placed distance atop three important technical levels — the 4,430 mark, the 50-day moving average, and the late-September peak (4,465).
In the process, the prevailing upturn has registered as statistically unusual, encompassing consecutive closes atop the 20-day volatility bands.
Tactically, the S&P 500’s backdrop supports a bullish intermediate-term bias to the extent the index maintains a posture atop the 4,430 area.
More immediately, a slow-motion breakout attempt technically remains underway. On further strength, an intermediate-term target projects from the October low to the 4,775-to-4,790 area.
No new setups today. Back in action Wednesday.

