S&P 500 extends technical breakout, vies for consecutive close atop 20-day volatility bands
Focus: S&P 500 and Dow industrials clear 20-day volatility bands, 10-year yield tags four-month high, TNX, PNC, AVGO, FSLR, INMD
Broadly speaking, the bigger-picture technicals continue to strengthen amid an October earnings season that, on balance, has exceeded expectations.
Against this backdrop, each big three U.S. benchmark has extended a mid-month technical breakout, placing distance back atop its 50-day moving average.
Editor’s Note: As always, updates can be directly accessed at chartingmarkets.substack.com.
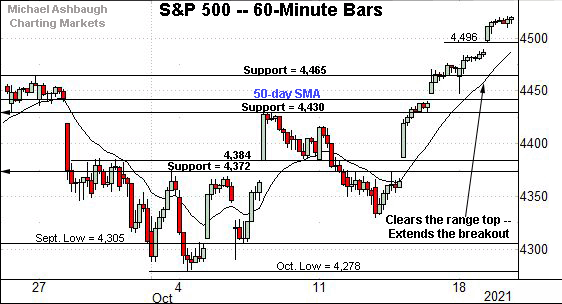
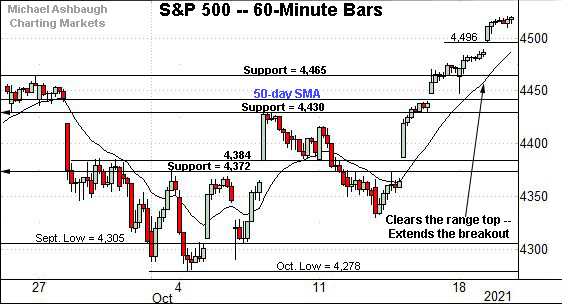
Before detailing the U.S. markets’ wider view, the S&P 500’s hourly chart highlights the past four weeks.
As illustrated, the S&P has extended its breakout, tagging one-month highs.
The prevailing upturn places its record close (4,536.85) and absolute record peak (4,545.85) firmly within striking distance.
Tactically, gap support (4,496) is followed by the firmer breakout point (4,465).
Similarly, the Dow Jones Industrial Average has extended its breakout.
Here again, the upturn places the Dow’s record close (35,625.40) and absolute record peak (35,631.19) firmly within view.
Tactically, a near-term floor, circa 35,400, is followed by support matching the May peak (35,091).
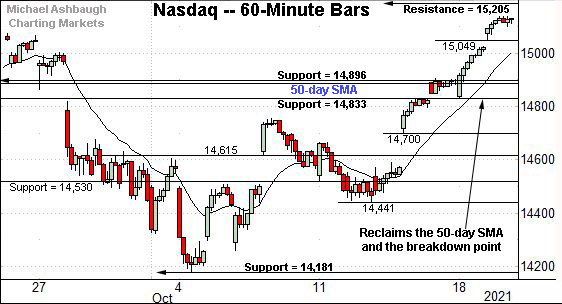
Against this backdrop, the Nasdaq Composite has also cleared its range top.
But in its case, record territory remains slightly more distant, as better illustrated below.
Tactically, the Nasdaq’s former breakdown point (14,896) marks major support.
Recall last week’s close (14,897) effectively matched the inflection point.
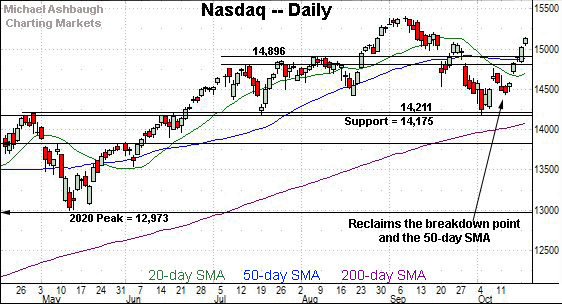
Widening the view to six months adds perspective.
On this wider view, the Nasdaq has broken out, placing distance atop its breakdown point (14,896) and the 50-day moving average.
To reiterate, last week’s close (14,897) effectively matched the breakdown point (14,896).
Tactically, the 14,900 area pivots to major support. A sustained posture higher signals a bullish intermediate-term bias.
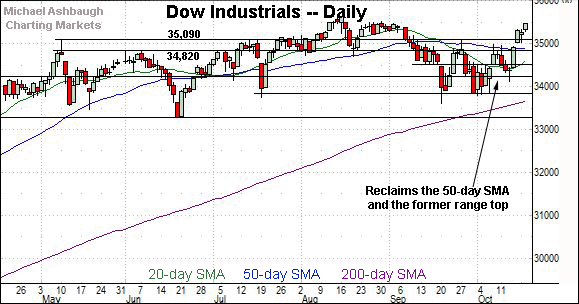
Looking elsewhere, the Dow Jones Industrial Average has also broken out.
The mid-October spike places record territory under siege. (See the hourly chart.)
Tactically, the Dow’s former range top (35,091) is followed by the 50-day moving average, currently 34,896, and the 34,820 support. A sustained posture atop this area signals a bullish intermediate-term bias.
Slightly more broadly, recall the prevailing upturn punctuates a mini double bottom defined by the September and October lows.
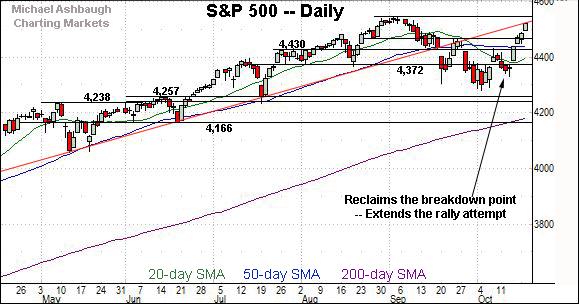
Similarly, the S&P 500 has staged a mid-October breakout.
Here again, the prevailing upturn places record territory firmly within view. (Also see the hourly chart.)
The bigger picture
As detailed above, the U.S. benchmarks seem to be back on the bull track amid a respectable mid-October breakout.
On a headline basis, each big three U.S. benchmark has placed distance atop major resistance, areas roughly matching the 50-day moving average — S&P 4,430, Dow 34,820 and Nasdaq 14,896.
Against this backdrop, bullish momentum has registered as statistically unusual in spots.
For instance, the Dow Jones Industrial Average has staged a two standard deviation breakout, closing atop its 20-day volatility bands across two of the prior three sessions.
Meanwhile, the S&P 500 has notched a lone close atop the 20-day volatility bands, and is vying Wednesday to register the more reliably bullish consecutive closes higher.
Elsewhere, the Nasdaq Composite continues to lag behind the other benchmarks — (by several technical metrics) — as it has not closed atop the 20-day bands.
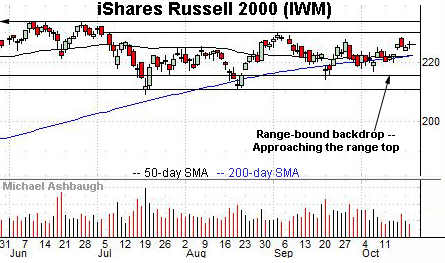
Moving to the small-caps, the iShares Russell 2000 ETF remains range-bound.
Tactically, the prevailing upturn places a three-month range top (229.84) within striking distance.
Follow-through atop resistance would punctuate a bullish double bottom.
Meanwhile, the SPDR S&P MidCap 400 ETF has rallied within view of all-time highs.
Tactically, the MDY’s record close (506.04) and absolute record peak (507.63) remain under siege.
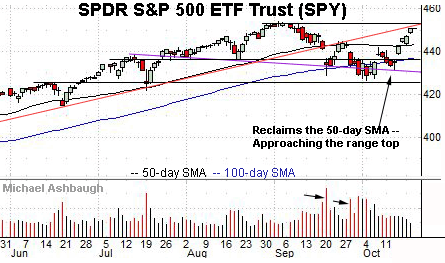
Looking elsewhere, the SPDR Trust S&P 500 ETF has extended its rally attempt, rising amid decreased volume.
Still, the prevailing upturn punctuates a “higher high” wrecking the SPY’s developing head-and-shoulders top. (See the rally from the pattern’s neckline, in purple.)
Placing a finer point on the S&P 500, the index has broken decisively to one-month highs.
To reiterate, the prevailing upturn marks an unusual two standard deviation breakout, encompassing a lone close atop the 20-day Bollinger bands.
The S&P is vying Wednesday for a more reliably bullish consecutive close atop the bands.
More broadly, the S&P 500 has knifed atop three important technical levels — the 4,430 mark, the 50-day moving average, and the late-September peak (4,465).
The breakout signals a bullish intermediate-term bias to the extent these areas are maintained.
More immediately, the prevailing upturn places record territory firmly within striking distance.
To reiterate, the S&P’s record close (4,536.85) and absolute record peak (4,545.85) rest just slightly overhead. The pending retest from underneath may be a useful bull-bear gauge.
Beyond technical levels, the markets’ best six months seasonally — November through April — are less than two weeks away. This seasonal pattern is a global-market phenomenon, and may present an added tailwind.
Editor’s note: The next review will be published Monday.
Watch List
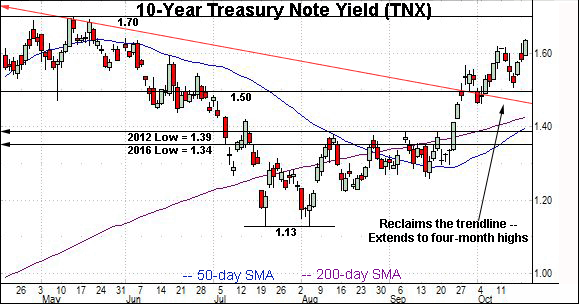
Drilling down further, the 10-year Treasury note yield has tagged four-month highs.
The prevailing upturn builds on a September trendline breakout.
On further strength, the prevailing range top (1.70) is closely followed by the 2021 peak (1.765).
Conversely, the 1.50 mark is followed by the 200-day moving average, currently 1.43, and the September breakout point (1.39). A sustained posture atop the breakout point signals a yield-bullish bias.
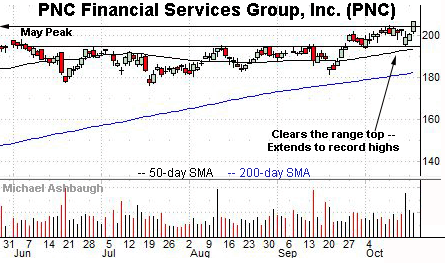
Moving to specific names, PNC Financial Services Group, Inc. is a well positioned large-cap name. (Yield = 2.5%.)
As illustrated, the shares have staged an early-week bullish reversal, rising from support amid a volume spike after posting better-than-expected quarterly results.
The upturn has been punctuated by a modest break to record territory.
Tactically, the breakout point (203.70) is followed by the former range bottom (195.40). The prevailing rally attempt is intact barring a violation.
Broadcom, Inc. is a well positioned large-cap semiconductor name.
As illustrated, the shares have rallied to the range top, rising to challenge record highs. The prevailing upturn originates from trendline support.
Tactically, a breakout attempt is in play barring a violation of the week-to-date low (498.70). Conversely, an intermediate-term target projects to the 545 area on follow-through.
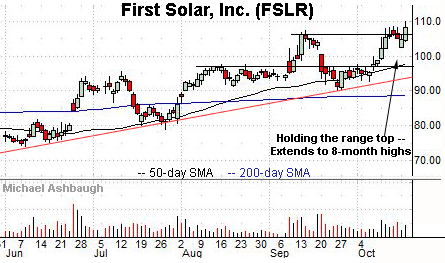
First Solar, Inc. is a large-cap name coming to life.
Technically, the shares have tagged eight-month highs, edging atop resistance matching the September peak. The prevailing upturn has been fueled by a sustained volume increase.
Tactically, a bull-flag breakout attempt is in play barring a violation of near-term support, circa 102.50.
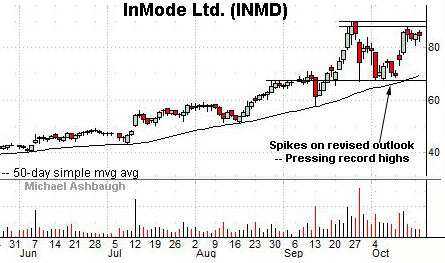
Finally, InMode Ltd. — public since August 2019 — is a large-cap Israel-based developer of medical technologies.
As illustrated, the shares have recently knifed toward the range top, rising amid a volume spike after the company’s upwardly revised full-year guidance.
The subsequent pullback has been flat, fueled by decreased volume, laying the groundwork for a potential break to record highs. Tactically, the breakout attempt is intact barring a violation of near-term support (80.70).
Editor’s note: The next review will be published Monday.


