Charting market rotation, Dow industrials edge atop 200-day average
Focus: Major U.S. benchmarks extend trendline breakouts ahead of the Fed
Technically speaking, the major U.S. benchmarks have extended a late-year rally attempt.
Against this backdrop, each index has placed distance atop a key trendline, though amid rallies that get mixed marks for style. The bigger-picture technicals are not one-size-fits-all.
Editor’s Note: As always, updates can be directly accessed at https://chartingmarkets.substack.com.
Before detailing the U.S. markets’ wider view, the S&P 500’s hourly chart highlights the past four weeks.
As illustrated, the S&P has sustained a break to one-month highs.
Tactically, the breakout point — the 3,790-to-3,810 area — pivots to support.
Conversely, major resistance matches the 3,900 mark. Both areas are also detailed on the daily chart.
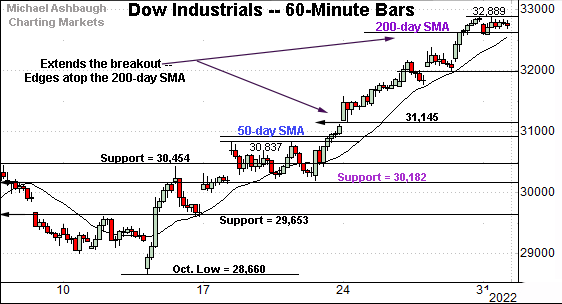
Meanwhile, the Dow Jones Industrial Average has broken out more decisively.
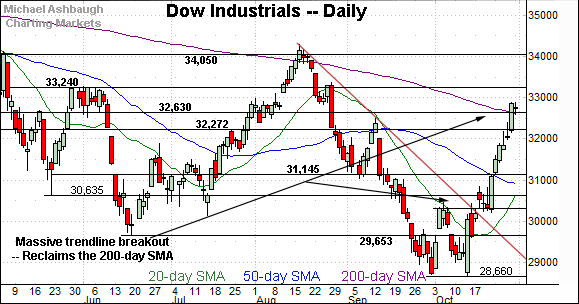
In the process, the blue-chip benchmark has edged atop its 200-day moving average, currently 32,610.
Recall the prevailing upturn punctuates a flag-like pattern — the tight range — underpinned by major support (30,182).
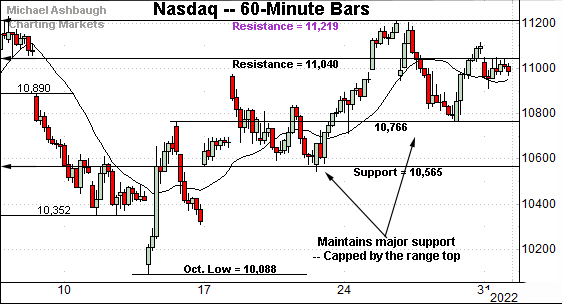
Against this backdrop, the Nasdaq Composite continues to underperform the other benchmarks.
In fact, the index remains capped by major resistance (11,219), an area established after the Federal Reserve’s Sept. 21 policy statement. (The S&P 500 and Dow industrials have cleared corresponding inflection points, detailed in purple.)
Tactically, near-term support (10,766) is followed by a firmer floor (10,565) also detailed on the daily chart below.
(Recall Nasdaq 10,565 corresponds with S&P 3,636, areas that have underpinned the prevailing rally attempt.)
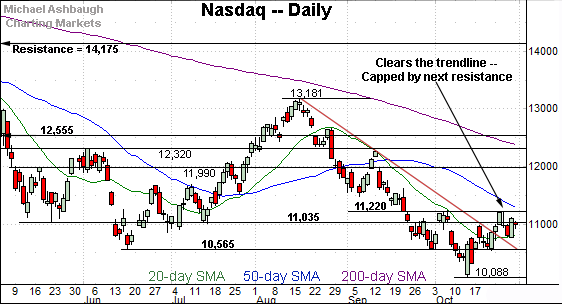
Widening the view to six months adds perspective.
On this wider view, the Nasdaq has sustained its recent trendline breakout.
Still, the upturn has been capped by next resistance (11,220), an area also detailed on the hourly chart. The late-October peak (11,210) registered nearby.
As detailed previously, follow-through atop this area would mark a “higher high” confirming the October trend shift. Note the 50-day moving average, currently 11,250, is descending toward resistance (11,220).
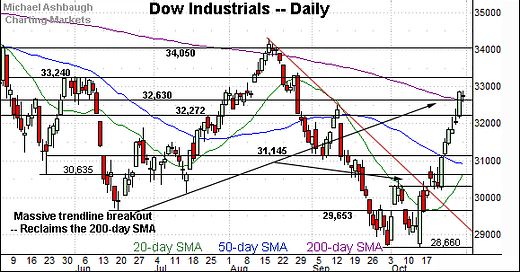
Looking elsewhere, the Dow Jones Industrial Average has staged a nearly straightline spike from the October low.
The aggressive rally places it slightly atop the 200-day moving average, currently 32,610. As always, the 200-day moving average is a widely-tracked longer-term trending indicator.
The catch here is the Dow is the only benchmark to reclaim its 200-day moving average, and as a price-weighted index, with just 30 components, it’s the least representative index.
Nonetheless, the Dow’s steep trendline breakout signals a rotational backdrop toward “value” more often derived from tangible products, and away from “growth” companies, which in the recent market context, frequently rely on advertising revenue and products on the order of “likes.“
Rising interest rates have fueled the rotational backdrop. (See the Dow industrials’ daily chart versus the Nasdaq’s.)
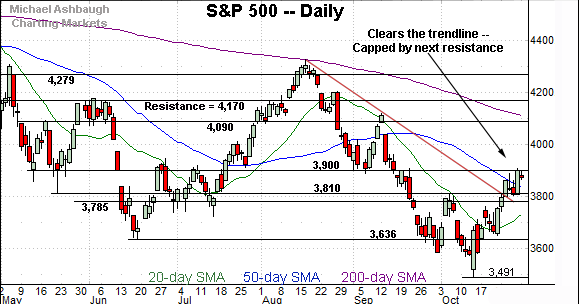
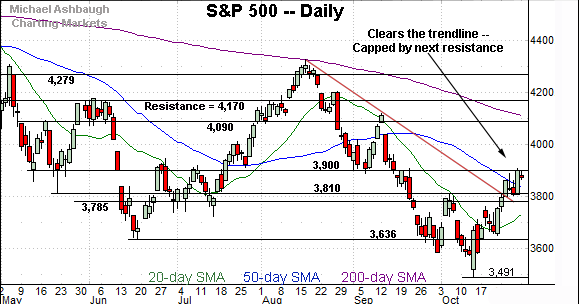
Meanwhile, the S&P 500 has extended a less aggressive trendline breakout.
Amid the upturn, the index has reclaimed major resistance (3,810) and observed this area as support. Friday’s session low (3,808) registered nearby.
Conversely, the rally attempt has thus far balked at next resistance (3,900), a level matching the June gap (3,900) and the May closing low (3,900).
More broadly, the S&P 500 and Nasdaq Composite remain firmly under the 200-day moving average (in purple), unlike the Dow industrials.
The bigger picture
As detailed above, the major U.S. benchmarks have extended a late-year rally attempt.
Against this backdrop, each big three U.S. benchmark has placed distance atop trendline resistance, rising amid rallies that get mixed marks for style. (See the daily charts.)
Moving to the small-caps, the iShares Russell 2000 ETF (IWM) has come to life technically.
As illustrated, the small-cap benchmark has extended its trendline breakout, also placing distance atop the 50-day moving average, currently 177.12.
Tactically, the 177.50 area pivots to support. The prevailing rally attempt is intact barring a violation.
Meanwhile, the SPDR S&P MidCap 400 ETF (MDY) has also turned higher.
In its case, the trendline closely tracks the 50-day moving average, currently 431.25.
From current levels, the breakout point (429.70) remains notable support.
Slightly more broadly, the small- and mid-caps are rising from a double bottom — the W formation — defined by the September and October lows. (The Dow Jones Industrial Average has knifed more decisively from a double bottom.)
Returning to the six-month view, the S&P 500 has extended its rally attempt, rising to tag nearly six-week highs.
As detailed previously, the 3,810 area pivots to major support. Friday’s session low (3,808) registered nearby.
To reiterate, the prevailing rally attempt is intact barring a violation of the 3,810 area.
Conversely, the 3,900 mark remains the next signficant hurdle. Sustained follow-through atop this area would confirm the October trend shift, strengthening the intermediate-term bull case.
Beyond specific levels, the S&P 500’s bigger-picture backdrop remains bearish pending more extensive repairs. The response to the Federal Reserve’s policy statement, due out Wednesday, will likely add color.

