


Charting market cross currents, U.S. benchmarks register jagged 2025 start
Focus: U.S. benchmarks rattle Fed-fueled range to start the New Year

Technically speaking, the major U.S. benchmarks are off to a jagged 2025 start.
Amid the cross currents, the benchmarks have diverged against a range-bound backdrop that is not one-size-fits-all. The charts below add color:
Editor’s Note: As always, updates can be directly accessed at chartingmarkets.substack.com.
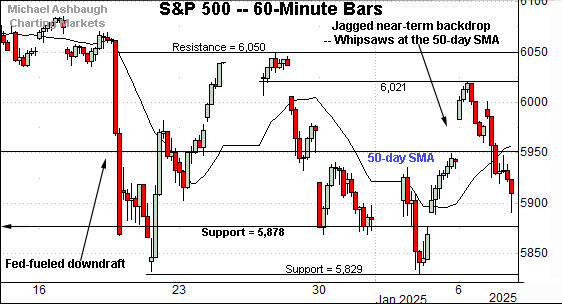
Before detailing the U.S. markets’ wider view, the S&P 500’s hourly chart highlights the past four weeks.
As illustrated, the S&P 500 has asserted a jagged three-week range, digesting the December Fed-fueled downdraft.
Tactically, the range has been underpinned by major support (5,878) — an area detailed previously — and better illustrated on the daily chart.
Separately, the prevailing range is effectively bisected by the 50-day moving average, currently 5,950.
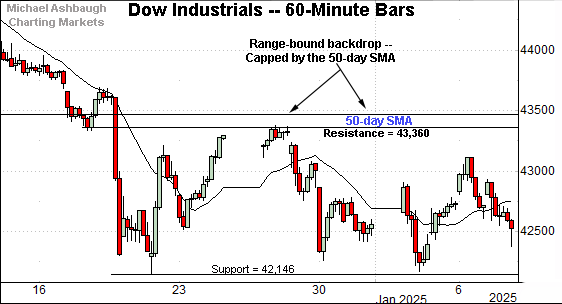
Meanwhile, the Dow Jones Industrial Average has asserted a lower plateau.
Tactically, the prevailing range is capped by the 50-day moving average, currently 43,450, as well as resistance around 43,360.
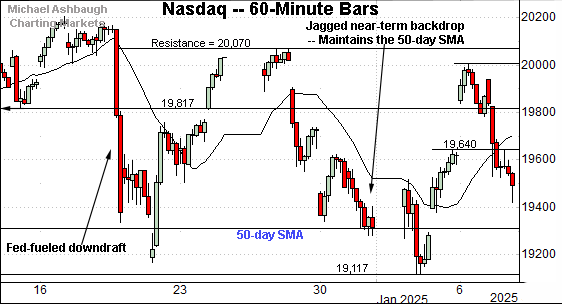
Against this backdrop, the Nasdaq Composite is traversing a volatile three-week range.
Like the other benchmarks, the prevailing range is hinged to the December Fed-fueled downdraft.
Unlike the other benchmarks, recent price action has been underpinned by the 50-day moving average, currently 19,305.
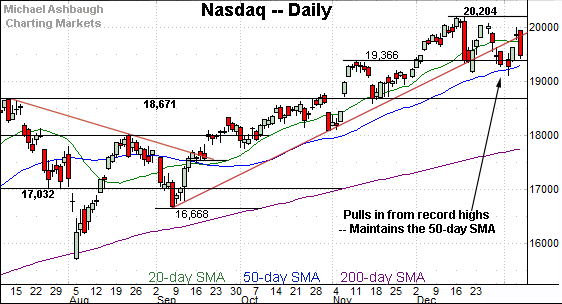
Widening the view to six months adds perspective.
On this wider view, the Nasdaq has asserted a holding pattern, digesting a downturn from all-time highs.
Recent turn-of-the-year volatility has effectively been underpinned by the breakout point (19,366) and the ascending 50-day moving average, currently 19,305.
Delving deeper, the November breakout point (18,671) remains a bull-bear fulcrum, an area the index has maintained since the U.S. election. The Nasdaq’s intermediate-term bias remains bullish barring a violation of this area.
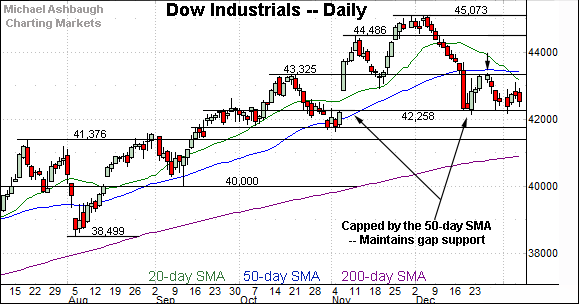
Looking elsewhere, the Dow Jones Industrial Average has asserted a lower plateau.
The prevailing range is capped by the breakdown point (43,325) and the flatlining 50-day moving average, currently 43,450.
Conversely, the prevailing range is underpinned by gap support (42,258) an area detailed previously.
More broadly, the prevailing range punctuates a 10-session December losing streak, the Dow’s longest stretch in 50 years.

Meanwhile, the S&P 500 has also pulled in from recent record highs.
Tactically, the prevailing range is effectively hinged to the 50-day moving average, currently 5,950. (Also see the hourly chart.)
Separately, the breakout point (5,978) has largely underpinned the pullback an area that has offered support since the U.S. election.
The bigger picture
As detailed above, the major U.S. benchmarks have diverged amid a jagged start to the New Year. Each benchmark is doing slightly different things.
But broadly speaking, each benchmark has asserted a three-week range hinged to the December Fed-fueled downdraft.
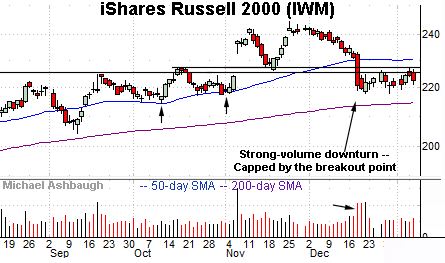
Moving to the small-caps, the iShares Russell 2000 ETF (IWM) is digesting the December downdraft.
The subsequent rally attempt has been flat, fueled by decreased volume, and capped by the breakdown point.
Tactically, upside follow-through atop the Jan. peak (227.17) and the 50-day moving average, currently 230.40, would strengthen the backdrop.
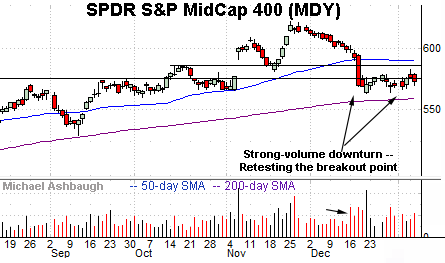
Similarly, the SPDR S&P MidCap 400 ETF (MDY) is digesting the late-year downdraft.
Here again, the subsequent rally attempt has been flat, and fueled by decreased volume. Tactically, a rally atop the Jan. peak (282.32) and the 50-day moving average, currently 290.05, would strengthen the backdrop.
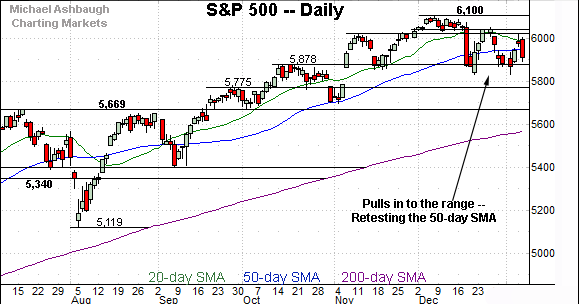
Returning to the S&P 500, the index has pulled in to a slightly lower plateau.
Recall the initial Dec. 18 downturn (long red bar) marked a powerful 9-to-1 down day following unexpectedly hawkish-leaning Federal Reserve policy language. (That day, declining volume surpassed advancing volume by an unusually strong 9-to-1 margin.)
The index has subsequently chopped, asserting a three-week range hinged to the aggressive downturn.
Tactically, the Dec. 18 close (5,872) roughly matched the S&P’s breakout point (5,878). So the 5,872-to-5,878 area marks an inflection point. A violation of this area would raise a caution flag.
Delving deeper, likely last-ditch support matches the October gap 5,775, established immediately preceding the U.S. election. (This area technically matches twin gaps at 5,775 and 5,782, defining an island reversal underpinned by the 50-day moving average. The U.S. election punctuated the bullish pattern.)
As always, it’s not just what the markets do, it’s how they do it.
In the current case, the powerful mid-December downdraft has been punctuated by a bull-bear stalemate. Though downside follow-through remains elusive, the subsequent chop — or slight volatility spike — has registered despite a seasonally favorable turn-of-the-year backdrop.
Broadly speaking, the S&P 500’s intermediate-term bias remains bullish-leaning barring a violation of the 5,775 area. The next few weeks will likely add color.
Also see Dec. 19: Market bears resurface, S&P 500 challenges major support (5,878).