Charting market cross currents, U.S. benchmarks return to former range
Focus: Pockets of sector weakness persist amid global-market cross currents, XHB, KRE, XLF, FXI, IEV, ILF
Technically speaking, the major U.S. benchmarks are poised to start April against a still relatively volatile, and challenging, bigger-picture backdrop.
Amid the cross currents, each big three benchmark has pulled in to its former range, pressured thus far modestly in the wake of a massive March rally.
Editor’s Note: As always, updates can be directly accessed at https://chartingmarkets.substack.com.
Before detailing the U.S. markets’ wider view, the S&P 500’s hourly chart highlights the past four weeks.
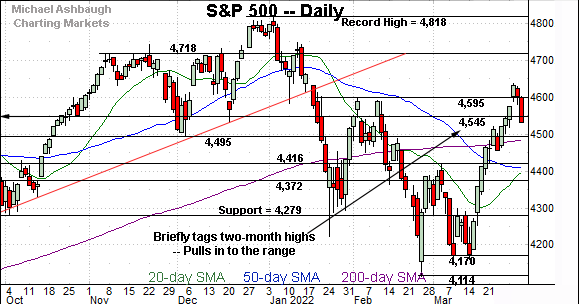
As illustrated, the S&P has reversed from two-month highs.
Tactically, major support (4,495) is closely followed by the 200-day moving average, currently 4,485.
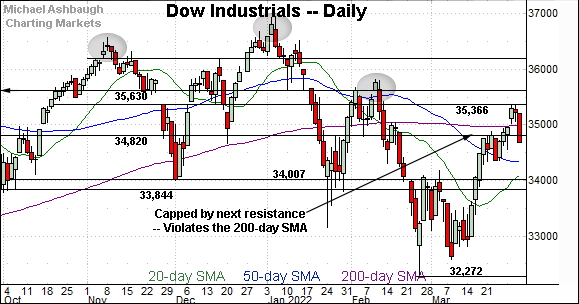
Meanwhile, the Dow Jones Industrial Average has pulled in from six-week highs.
The pullback originates from major resistance (35,366) an area detailed on the daily chart.
Consecutive session highs — Tuesday (35,372) and Wednesday (35,361) — closely matched resistance.
More immediately, the prevailing pulback places the Dow back under its 200-day moving average, currently 34,995.
Against this backdrop, the Nasdaq Composite has also pulled in.
The prevailing downturn places major suport (14,175) within view. Friday’s early session low (14,183) registered nearby.
Widening the view to six months adds perspective.
On this wider view, the Nasdaq has reversed from two-month highs, topping slightly under the 200-day moving average, currently 14,730.
From current levels, major support (14,175) is followed by the mid-March breakout point (13,850). The flattening 50-day moving average rests slightly lower.
Tactically, the Nasdaq’s intermediate-term bias remains bullish barring a violation of these areas.
Looking elsewhere, the Dow Jones Industrial Average has effectively nailed major resistance (35,366).
To reiterate, consecutive session highs — Tuesday (35,372) and Wednesday (35,361) — closely matched resistance. Selling pressure has surfaced.
The prevailing pullback places the index back under its 200-day moving average, currrently 34,995, as well as the 34,820 inflection point.
Meanwhile, the S&P 500 has pulled in to its range from two-month highs.
Tactically, major support spans from 4,485 to 4,495, the former matching the 200-day moving average.
The bigger picture
As detailed above, the major U.S. benchmarks are poised to start the second quarter (beginning April) against a still relatively challenging bigger-picture backdrop.
Amid the cross currents, each big three benchmark has pulled in to its former range to punctuate a massive March rally.
Moving to the small-caps, the iShares Russell 2000 ETF has sustained a trendline breakout, though material follow-through remains elusive.
Based on today’s backdrop, notable resistance holds in the 211.10-to-212.25 area.
Conversely, trendline support closely matches the 50-day moving average, currently 201.20. The prevailing rally attempt is intact barring a violation.
Meanwhile, the SPDR S&P MidCap 400 ETF has also reversed from two-month highs.
The prevailing pullback places it back under the 200-day moving average, currently 495.24, an area that has defined its two-month range top.
Combined, the small- and mid-cap benchmarks concluded March with false breakouts. The subsequent downside follow-through, or lack thereof, will likely add color.
(On a granular note, the S&P MidCap 400 and Dow industrials have concurrently whipsawed at the 200-day moving average.)
Returning to the S&P 500, the index has extended a pullback from two-month highs.
The prevailing downturn punctuates an aggressive 12-session March spike, spanning as much as 476 points, or 11.4%.
Tactically, the S&P’s immediate violation of major support (4,545) — on the first retest — raises a question mark. (Friday’s early session high (4,548) has registered nearby amid a test from underneath.) Still, the assertive pullback may simply be a function of the prior ridiculous rally from the March low.
Delving deeper, a more important floor spans from the 200-day moving average, currently 4,485, to major support (4,495) matching the December low.
As always, it’s not just what the markets do, it’s how they do it.
But generally speaking, the S&P 500’s recovery attempt is intact barring a violation of the 4,485-to-4,495 area. A nearly immediate violation of this area would raise a caution flag.
(On a granular note, the 4,545 resistance registers on the monthly chart, as detailed Monday. Last week’s close (4,543) registered nearby. The S&P is vying Friday for its first weekly close atop this area since mid-January.)
Editor’s note: The next review will be published Tuesday.
Watch List — Pockets of sector weakness persist
Drilling down further, Wednesday’s review detailed signs of sector rotation as a supportive backdrop for stocks. (For instance, the insurance sector has knifed to all-time highs, as the biotech sector vies to sustain a nascent trend shift.)
Today’s review details lingering pockets of sector weakness. Three groups exemplify the market overhang:
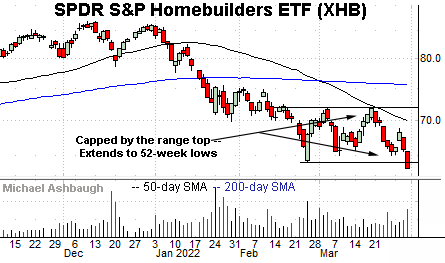
To start, the SPDR S&P Homebuilders ETF (XHB) has reached 52-week lows.
The downturn has been fueled by increased volume, and originates from a failed test of the March range top.
Tactically, the breakdown point, circa 64.20, pivots to resistance.
Similarly, the SPDR S&P Regional Banking ETF (KRE) has failed a recent technical test.
In its case, the group has stalled at trendline resistance roughly matching the 50-day moving average.
The prevailing downturn places the group slightly back under the 200-day moving average, currently 69.36. Tactically, a sustained posture under the 200-day likely lays the groundwork for a retest of the March low.
Looking elsewhere, the Financial Select Sector SPDR (XLF) remains relatively stronger than the prior two sectors.
Still, the group concluded March with a violation of the 50- and 200-day moving averages.
Though not panic-button material, this area would be expected to hold if a durable recovery were in play. Recall the 50-day moving average has marked a well-defined bull-bear inflection point. (See the December price action.)
Beyond the U.S. — Regional market cross currents persist
Moving beyond the U.S., familiar global-market cross currents are intact. Three regions exemplify the prevailing backdrop:
To start, the iShares China Large-Cap ETF (FXI) is digesting a damaging March downdraft.
As illustrated, the shares have reversed respectably from 13-year lows, though the rally attempt has stalled firmly under the breakdown point (35.25).
Tactically, the post-breakdown peak (33.73) is followed by the 50-day moving average and the breakdown point (35.25). The pending retests from underneath should be a useful bull-bear gauge.
Similarly, the iShares Europe ETF (IEV) is digesting a massive March downdraft.
Tactically, the rally attempt has stalled near the breakdown point (51.40) a level from which selling pressure has surfaced. Sustained follow-through atop this area would place the shares on firmer technical ground.
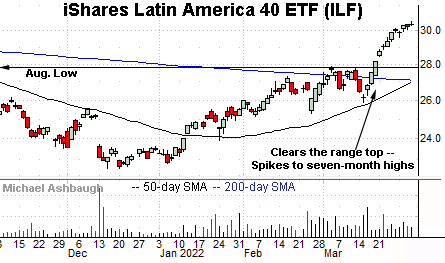
Against this backdrop, the Latin America ETF (ILF) — detailed last week — continues to outperform. Persistent commodity-price strength has contributed to an aggressive breakout.
Though near-term extended, and due to consolidate, the breakout point (27.75) pivots to support. The prevailing rally attempt is intact barring a violation.
More broadly, recall the pending golden cross — or bullish 50-day/200-day moving average crossover — an event likely to signal next week.
In related price action, the iShares MSC Brazil ETF (EWZ) — detailed Wednesday — is also digesting a steep breakout.


