Charting market cross currents, S&P 500 nails the breakdown point
Focus: Regional banks sustain breakout, Ford Motor Co. and Caterpillar rise amid bullish chart patterns, KRE, F, CAT, EMR, FCX
U.S. stocks are slightly higher mid-day Wednesday, rising despite a consumer price report signaling year-over-year inflation running at its hottest pace since 1982.
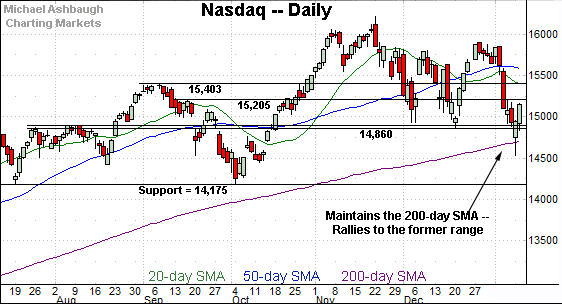
Against this backdrop, the Nasdaq Composite has extended a rally from its 200-day moving average — to punctuate its first test since April 2020 — while the S&P 500 has rallied to retest its breakdown point.
Editor’s Note: As always, updates can be directly accessed at chartingmarkets.substack.com.
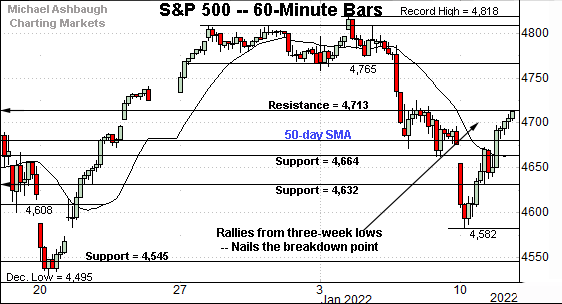
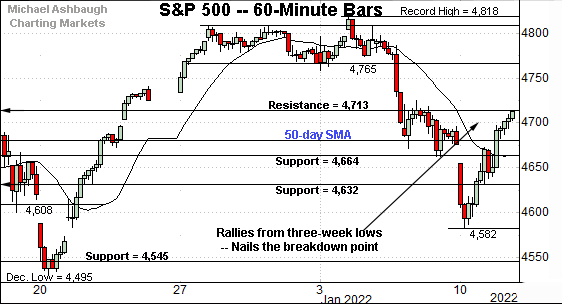
Before detailing the U.S. markets’ wider view, the S&P 500’s hourly chart highlights the past four weeks.
As illustrated, the S&P has reversed respectably from three-week lows.
Tuesday’s close (4,713) matched the breakdown point, and the index has followed through higher early Wednesday.
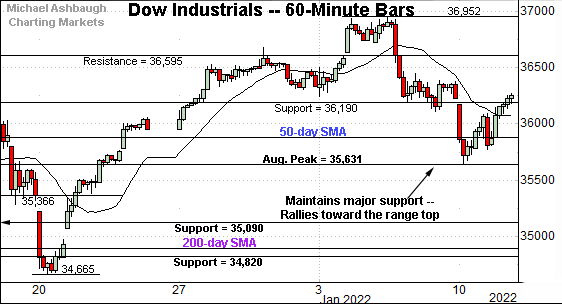
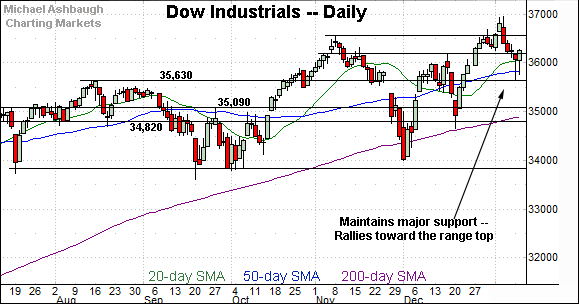
Similarly, the Dow Jones Industrial Average has rallied from the January low.
The prevailing upturn originates from major support (35,631), an area better illustrated on the daily chart.
The week-to-date low (35,639) has roughly matched support to punctuate a successful retest.
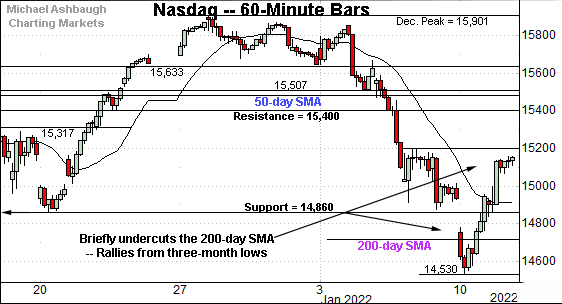
Perhaps not surprisingly, the Nasdaq Composite remains the weakest major benchmark.
As illustrated, the index briefly undercut its 200-day moving average, before reversing from three-month lows.
From current levels, initial resistance, circa 15,200, is followed by additional overhead (15,317) detailed previously.
Wednesday’s early session high (15,319) has matched the latter.
Widening the view to six months adds perspective.
On this wider view, the Nasdaq has reversed respectably from its 200-day moving average, currently 14,711.
Though admittedly brief, this marked its first venture under the 200-day moving average since April 2020, amid the pandemic-fueled market carnage.
Separately, the Nasdaq has thus far maintained major support (14,860) on a closing basis. To reiterate, an eventual violation of this area would mark a material “lower low” likely raising a technical red flag.
More broadly, see the developing triple top defined by the November and December peaks. Recall major support is frequently violated on the third or fourth independent test.
(On a granular note, the Nasdaq’s prevailing sentiment backdrop remains comfortably bearish. For instance, the Nasdaq 100 Index has registered a “lower closing low” versus the December low, while the CBOE Nasdaq 100 Volatility Index (VXN) has fallen firmly short of notching a corresponding “higher high.”)
Looking elsewhere, the Dow Jones Industrial Average continues to outperform the Nasdaq Composite.
As illustrated, the index has staged a bullish reversal from major support (35,630).
The week-to-date low (35,639) has effectively matched support, and the successful retest keeps record highs within view.
The Dow’s prevailing backdrop supports a bullish intermediate-term bias.
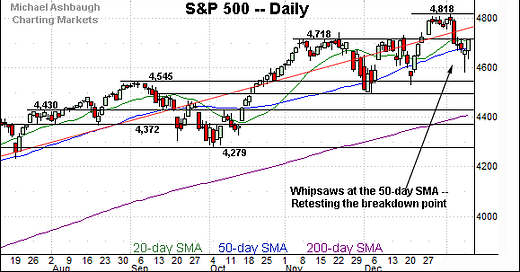
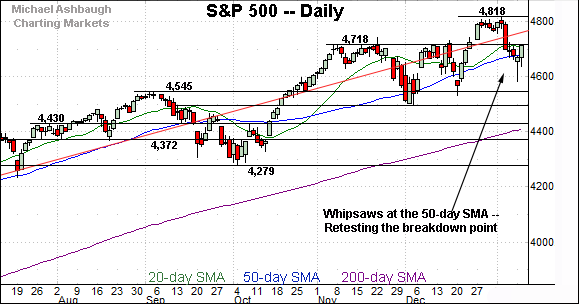
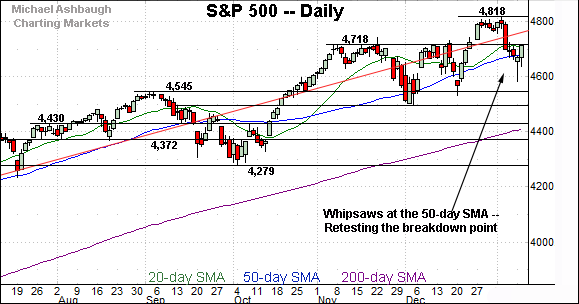
Meanwhile, the S&P 500 has weathered a jagged test of its 50-day moving average, currently 4,680.
(The index has thus far registerd a single close under the 50-day moving average, by a narrow six-point margin.)
More immediately, the bullish reversal places its breakdown point — the 4,713-to-4,718 area — back in play. An extended test remains underway Wednesday.
The bigger picture
As detailed above, the major U.S. benchmarks are off to a jagged 2022 start. Amid the cross currents, the prevailing backdrop is not one-size-fits-all.
On a headline basis, the S&P 500 and Dow industrials have thus far retained a bullish intermediate-term bias.
Meanwhile, the Nasdaq Composite is more tenuously positioned — atop major support (14,860) — amid a sentiment backdrop that keeps the door open to incremental downside from current levels.
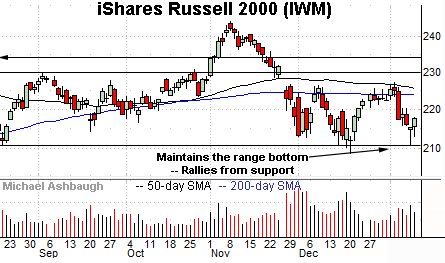
Moving to the small-caps, the iShares Russell 2000 ETF remains range-bound amid a bearish backdrop.
Nonetheless, the small-cap benchmark has maintained its range bottom. Notable support rests in the 210.70-to-211.10 area.
Slightly more broadly, the prevailing six-week range is capped by the 50-day moving average, a level matching the November omicron-fueled gap.
Also see the modified head-and-shoulders top, defined by the September, November and January peaks.
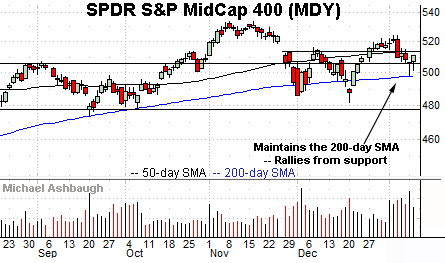
Meanwhile, the SPDR S&P MidCap 400 ETF remains comparably stronger than the Russell 2000.
Technically, the MDY has just staged a successful test of its 200-day moving average, currently 498.24.
The bullish reversal places it back above the former range top (507.30).
Placing a finer point on the S&P 500, the index has rallied from three-week lows.
To reiterate, Tuesday’s close (4,713) matched the breakdown point — the 4,713-to-4,718 area — also illustrated below.
An extended retest remains in play Wednesday.
More broadly, the S&P 500 is acting well enough in the broad sweep.
To start, the index remains within a series of “higher highs” and “higher lows” even amid recent volatility. By this measure, its prevailing price action defines an uptrend.
Still, the S&P has violated its breakout point — the 4,718 area — and the prevailing retest from underneath may be a usefull bull-bear gauge.
Tactically, the 50-day moving average, currently 4,680, is followed by the January low (4,582).
Delving deeper, likely last-ditch support continues to match the former breakout point (4,545). Based on today’s backdrop, the S&P 500’s intermediate-term bias remains bullish barring a violation of this area.
(On a granular note, the 10-year Treasury note yield has stalled this week near its 200-week moving average, currently 1.79. (See link for chart.) The yield has not traded atop this longer-term trending indicator since May 2019. Eventual follow-through atop the 200-week moving average could open the path to material upside follow-through.)
Watch List
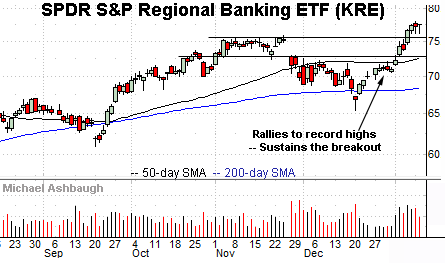
Drilling down further, the SPDR S&P Regional Banking ETF is acting well technically. (Yield = 2.1%.)
Earlier this month, the group knifed to record highs, clearing resistance matching the November peak.
Tactically, the breakout point (75.50) is followed by the ascending 50-day moving average, currently 72.50, a recent bull-bear inflection point. A sustained posture higher signals a bullish bias.
Surging Treasury yields, detailed previously, have contributed to the banks’ recent relative strength.
Moving to specific names, Ford Motor Co. is a well positioned large-cap name. (Yield = 1.6%.)
The shares started January with a strong-volume breakout, knifing to 20-year highs.
More immediately, the prevailing flag pattern signals still muted selling pressure, positioning the shares to build on the initial spike.
Tactically, the prevailing range bottom (23.30) is followed by deeper gap support (22.40).
Caterpillar, Inc. is a well positioned Dow 30 component. (Yield = 2.0%.)
As illustrated, the shares have recently knifed to seven-month highs, clearing the 200-day moving average on increased volume.
The breakout punctuates a double bottom — the W formation — defined by the October and December lows.
Tactically, the breakout point (215.90) is closely followed by the 200-day moving average, currently 213.75. The prevailing rally attempt is intact barring a violation.
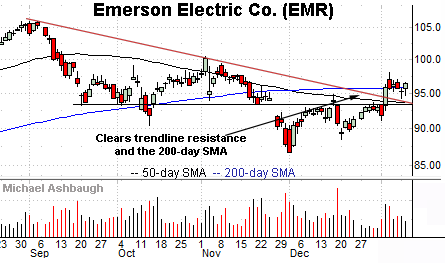
Emerson Electric Co. is a large-cap diversified industrial name. (Yield = 2.1%.)
Earlier this month, the shares knifed atop trendline resistance — as well as the 50- and 200-day moving averages — rising on increased volume.
The subsequent pullback has been flat, fueled by decreased volume, positioning the shares to build on the initial spike.
Tactically, trendline support closely matches the breakout point (93.40). The prevailing recovery attempt is intact barring a violation.
Finally, Freeport-McMoRan, Inc. is a large-cap copper and gold miner coming to life.
The shares seem to be getting away early Wednesday, rising sharply to tag seven-month highs.
The prevailing upturn punctuates a flag-like pattern, the tight range hinged to the late-December rally.
Tactically, a sustained posture atop the breakout point — the 42.20 area — signals a bullish bias.

