Charting a treacherous technical tilt, Nasdaq ventures under 200-day average
Focus: Homebuilders violate major support, Amazon and Google challenge key technical levels, XHB, AMZN, GOOGL, FB, NFLX
U.S. stocks are firmly lower mid-day Monday, pressured as surging Treasury yields remain a pronounced market headwind.
Against this backdrop, the Nasdaq Composite has ventured under its 200-day moving average, currently 14,689, edging lower for the first time since April 2020, amid the pandemic-fueled market carnage. The aggressive downturn raises the flag to a potential primary trend shift.
Editor’s Note: As always, updates can be directly accessed at chartingmarkets.substack.com.
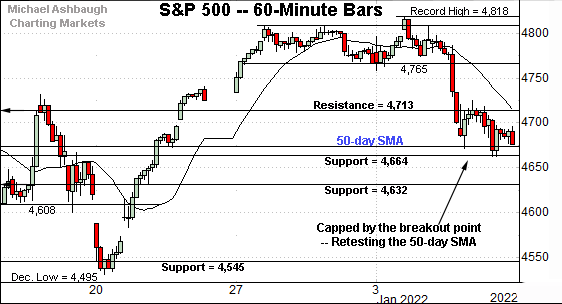
Before detailing the U.S. markets’ wider view, the S&P 500’s hourly chart highlights the past four weeks.
As illustrated, the S&P has reached an extended test of its 50-day moving average, currently 4,674.
Last week’s close (4,677) registered slightly atop the 50-day, and the index is firmly lower early Monday.
Tactically, the S&P’s former breakout point (4,545) marks its first significant floor, an area better illustrated on the daily chart.
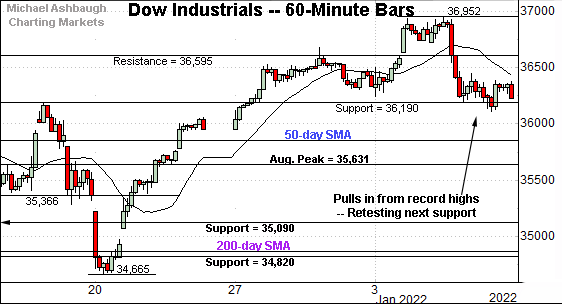
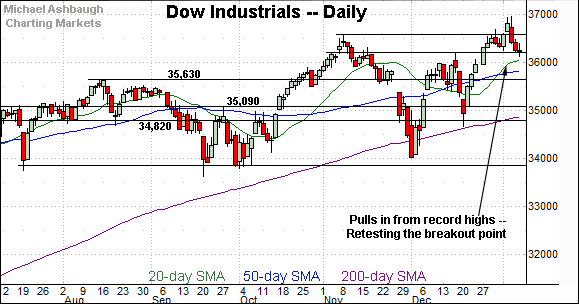
Meanwhile, the Dow Jones Industrial Average has also pulled in from a recent record high.
Here again, the index is firmly lower early Monday.
Tactically, major support matches the August peak (35,631), an area better illustrated on the daily chart.
Monday’s session low (35,639) has registered nearby.
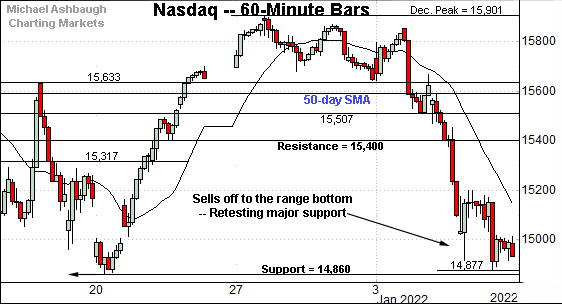
True to recent form, the Nasdaq Composite remains the weakest major benchmark.
As illustrated, the index challenged major support (14,860) to conclude last week.
This area marks a headline technical test — better illustrated below — and the Nasdaq has ventured firmly under support early Monday.
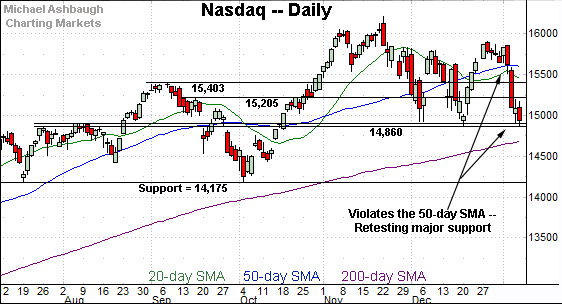
Widening the view to six months adds perspective.
On this wider view, the Nasdaq has reached a potentially consequential technical test.
Specifically, the index is challenging major support matching the December low (14,860) and July peak (14,863). The index has ventured firmly lower early Monday.
The prevailing downturn places the marquee 200-day moving average, currently 14,689, under siege. The Nasdaq has not closed under its 200-day moving average — a widely-tracked longer-term trending indicator — since April 2020, amid the pandemic-fueled market carnage.
Slightly more broadly, the prevailing downturn marks the third recent test of 14,860. Major support is frequently violated on the third or fourth independent test.
Looking elsewhere, the Dow Jones Industrial Average remains strikingly stronger than the Nasdaq Composite.
Still, the index pulled in to its breakout point — the 36,190 area — to conclude last week. (Also see the hourly chart.)
More immediately, Monday’s early downturn has swiftly placed major support (35,630) back in play.
To reiterate, Monday’s session low (35,639) registered nearby. Tactically, a sustained violation of major support (35,630) would signal a bearish-leaning intermediate-term bias.
(On a granular note, an arguably less important test of the 50-day moving average, currently 35,815, is also underway early Monday.)
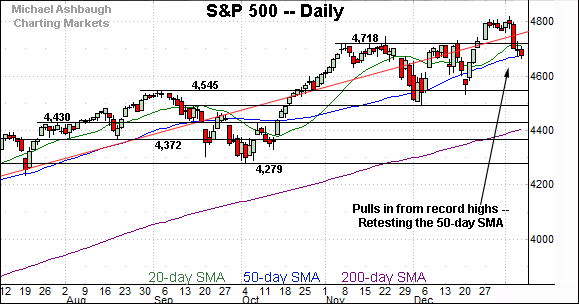
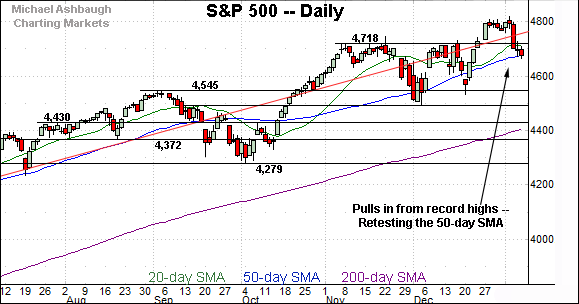
Meanwhile, the S&P 500 pulled in to its 50-day moving average to conclude last week.
The prevailing pullback punctuates a failed test of its breakout point — the 4,713-to-4,718 area — from underneath. (Also see the hourly chart.)
The bigger picture
As detailed above, potentially consequential technical tests are underway early Monday.
On a headline basis, the Nasdaq Composite has ventured firmly under major support (14,860) pulling in to challenge its 200-day moving average, currently 14,689.
The Nasdaq has not closed under its 200-day moving average since April 2020, amid the pandemic-driven market carnage.
Meanwhile, the Dow Jones Industrial Average has challenged major support (35,630), a level matching its former breakout point. Monday’s early session low (35,639) has closely matched major support.
Against this backdrop, the S&P 500 remains relatively resilient, though the index has ventured firmly under its 50-day moving average.
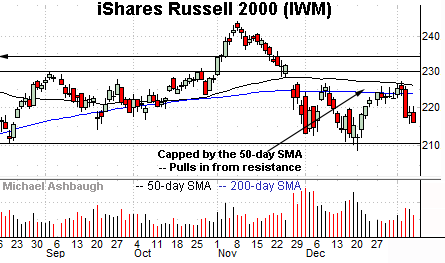
Moving to the small-caps, the iShares Russell 2000 ETF continues to underperform.
As illustrated, the small-cap benchmark has stalled near its 50-day moving average, a level matching the November gap. (The November gap is the omicron-fueled gap.)
Tactically, eventual upside follow-through atop the 226.75-to-227.15 area would mark technical progress.
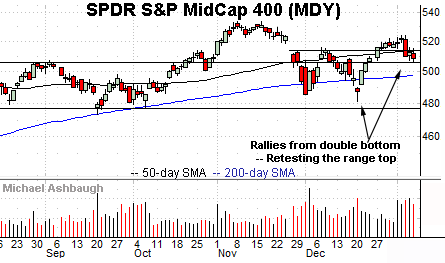
Meanwhile, the SPDR S&P MidCap 400 ETF remains relatively stronger than the Russell 2000.
Still, an extended test of the former range top (507.30) remains underway.
Delving deeper, the marquee 200-day moving average, currently 497.82, is increasingly within view.
Returning to the S&P 500, its bigger-picture backdrop remains relatively straightforward.
As illustrated, the index tagged its 50-day moving average, currently 4,674, to conclude last week.
More immediately, the index has extended its downturn early Monday.
As always, it's not just what the markets do, it’s how they do it.
But generally speaking, the S&P’s former breakout point (4,545) remains a headline bull-bear battleground. An eventual closing violation would mark a material “lower low” likely signaling a bearish intermediate-term trend shift.
Based on today’s backdrop, the S&P 500’s bullish intermediate-term bias gets the benefit of the doubt. The next several sessions — and the response to several key technical levels, detailed above — will likely add color.
Watch List
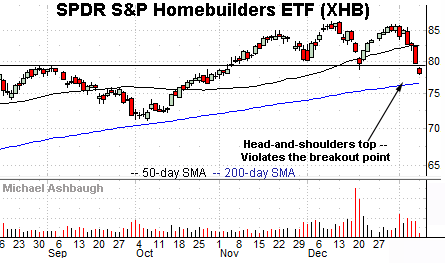
Drilling down further, the SPDR S&P Homebuilders ETF is tenuously positioned.
As illustrated, the group has violated major support, tagging two-month lows.
The prevailing downturn punctuates a head-and-shoulders top — defined by the November and December peaks — placing the 200-day moving average within view.
Tactically, the breakdown point (79.60) pivots to resistance. A reversal higher would place the brakes on bearish momentum.
Fundamentally, surging Treasury yields — detailed last week — have contributed to, if not outright fueled, the group’s downturn.
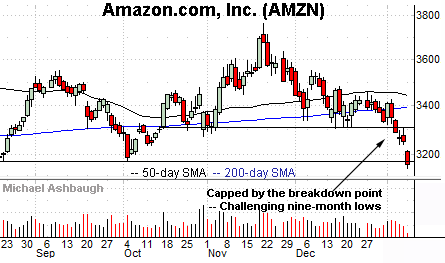
Moving to specific names, Amazon.com has broken down technically. The prevailing downturn originates from a failed test of the 50-day moving average at the late-December peak.
More immediately, the shares are challenging major support (3,176) matching the August and October lows. A sustained violation opens the path to potentially material downside follow-through.
Delving deeper, sigificant support spans from 2,871 to 2,881, levels defining Amazon’s 18-month range bottom.
Tactically, an eventual rally atop the breakdown point (3,312) would mark a step toward stabilization.
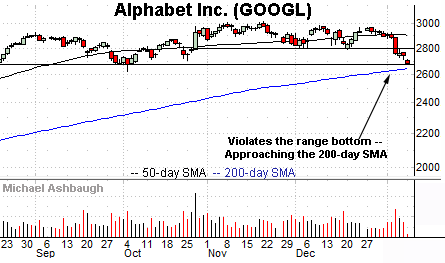
Looking elsewhere, Alphabet, Inc. has reached a major technical test.
Specifically, the shares are challenging major support — the 2,671-to-2,673 area — matching a five-month range bottom.
Downside follow-through likely opens the path to a retest of the 200-day moving average, currently 2,642.80.
Alphabet has not traded under its 200-day moving average since April 2020. (Note the 200-day subsequently defined the September 2020 low.)
Tactically, a rally atop the 2,800 mark would place the brakes on bearish momentum.
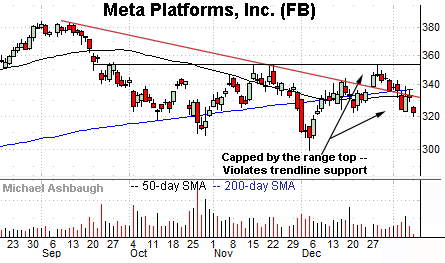
Meta Platforms, Inc. — the company formerly known as Facebook — has also asserted a bearish posture.
Technically, the shares have extended a violation of trendline support, an area roughly matching the 50- and 200-day moving averages.
The prevailing downturn punctuates a failed test of the range top at the December peak.
More broadly, Meta Platforms has not registered new lows, exhibiting relative strength versus its FANG counterparts.
Tactically, a sustained reversal atop the trendline — the 333 area — would place the shares on firmer technical ground.
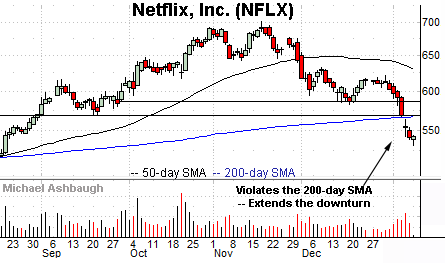
Finally, Netfilix, Inc. has broken down technically.
In the process, the shares have tagged four-month lows, placing distance under the 200-day moving average.
Tactically, the breakdown point, circa 567, closely matches the 200-day, and pivots to resistance. The pending retest from underneath should be a useful bull-bear gauge.


