Charting a head-and-shoulders top: S&P 500's corrective bounce fades
Focus: Transports challenge key trendline, Semiconductor sector presses 200-day average, Tesla's breakout attempt, TRAN, SMH, TSLA, EOG, FB
U.S. stocks are mixed early Wednesday, vacillating after hotter-than-expected inflation data, and despite a generally solid batch of corporate earnings reports.
Against this backdrop, the S&P 500 has extended a pullback from major resistance, reasserting a posture under its former breakdown point (4,372).
Editor’s Note: As always, updates can be directly accessed at chartingmarkets.substack.com.
Before detailing the U.S. markets’ wider view, the S&P 500’s hourly chart highlights the past four weeks.
As illustrated, the S&P has extended its downturn from major resistance (4,430).
The prevailing downturn has filled last week’s gap, placing the index back under its former breakdown point (4,372).
Meanwhile, the Dow Jones Industrial Average has pulled in from its range top.
The prevailing pullback punctuates a failed test of major resistance (34,820) and the 50-day moving average, currently 34,870.
Here again, the downturn places the Dow back under its former breakdown point (34,510).
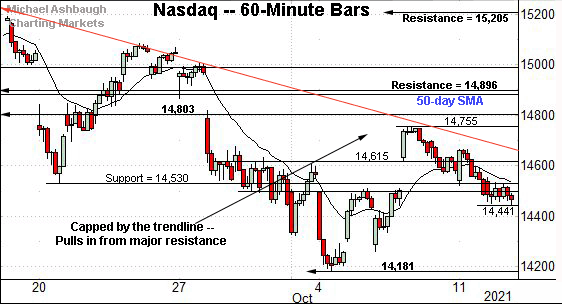
True to recent form, the Nasdaq Composite’s near-term backdrop remains the weakest of the major benchmarks.
As illustrated, the index has topped firmly under major resistance — the 14,800-to-14,900 area, also detailed below — and pulled in to fill last week’s gap.
Widening the view to six months adds perspective.
On this wider view, the Nasdaq is traversing a lower plateau, capped by its breakdown point (14,803). (Also see the hourly chart.)
Conversely, recall the October low (14,181) has closely matched major support (14,175).
The net result is a bearish intermediate-term backdrop, pending a rally back atop resistance broadly spanning from 14,803 to 14,896. The 50-day moving average rests within the resistance band.
Looking elsewhere, the Dow Jones Industrial Average has thus far stalled near familiar resistance.
The specific areas match the former breakdown point (34,820), and the 50-day moving average, currently 34,870.
Tactically, the Dow’s intermediate-term bias remains bearish pending a close atop this area, as well as slightly more distant resistance matching the May peak (35,091).
Meanwhile, the S&P 500 has balked at familiar resistance (4,430).
Recall last week’s high (4,429.97) — also the October peak — matched the inflection point.
More immediately, the prevailing pullback places the S&P back under its former breakdown point (4,372).
The bigger picture
Collectively, the major U.S. benchmarks’ intermediate-term bias remains bearish, based on today’s backdrop.
Moreover, each index has violated notable near-term support — S&P 4,372, Dow 34,510 and Nasdaq 14,530 — signaling the recent corrective bounce may have already run its course. (See the hourly charts.)
If the rally attempt were intact, these areas “should” have drawn buyers on the initial retest.
Moving to the small-caps, the iShares Russell 2000 ETF remains range-bound, holding tightly to its major moving averages.
The conspicuously flat October start contrasts with comparably pronounced volatility elsewhere.
Meanwhile, the SPDR S&P MidCap 400 ETF has asserted a posture between its 50- and 200-day moving averages amid a flat October start.
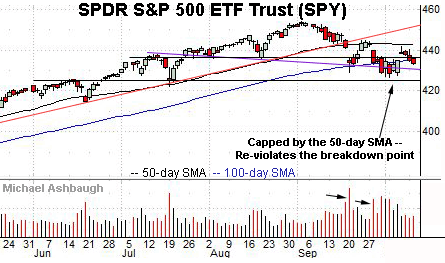
Looking elsewhere, the SPDR Trust S&P 500 ETF has asserted a series of “lower highs“ and “lower lows” consistent with a downtrend.
Market bears will point to a modified head-and-shoulders top, defined by the mid-August, early-September and late-September peaks.
The comparably lackluster October rally attempt has failed to neutralize the bearish pattern.
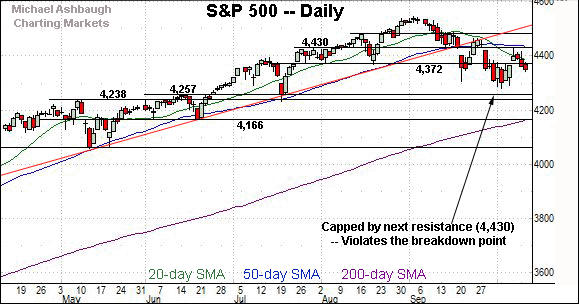
Placing a finer point on the S&P 500, the index has extended a pullback from major resistance (4,430).
In the process, the S&P has asserted a posture back under its former breakdown point (4,372). Bearish price action.
More broadly, the S&P 500 has asserted a two-week range, capped by major resistance (4,430) and the 50-day moving average, currently 4,435.
Range-bound price action is bearish — for the intermediate-term — against the prevailing backdrop.
Tactically, an eventual rally atop major resistance — the 4,430-to-4,435 area — would place the brakes on bearish momentum.
Follow-through atop the the late-September peak (4,465) would mark a material “higher high” wrecking the S&P 500’s developing head-and-shoulders top.
As always, it’s not just what the markets do, it’s how they do it. The next several sessions, and the markets’ response to October earnings season, will likely add color.
Watch List
Drilling down further, the Dow Transports continue to show signs of life technically.
As illustrated, the group has edged atop trendline resistance, circa 14,550, and the 50-day moving average, currently 14,528.
This area pivots to support, and the group’s rally attempt is intact barring a violation.
Conversely, eventual follow-through atop the September peak (14,936) would mark a material “higher high” more firmly signaling a trend shift.
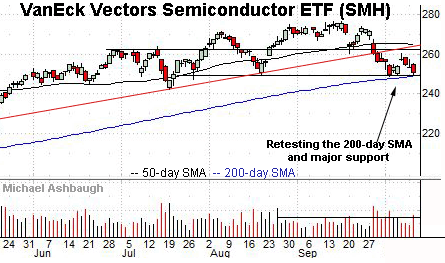
Conversely, the VanEck Vectors Semiconductor ETF — profiled Oct. 4 — remains tenuously positioned.
Late last month, the group violated trendline support, pressured amid a sustained volume increase.
The subsequent rally attempt has been comparably flat — fueled by decreased volume — and capped by the breakdown point (262.00).
Tactically, important support matches the August low (249.35) and the 200-day moving average, currently 249.04. An eventual violation would signal a primary trend shift, opening the path to potentially swift downside follow-through.
More broadly, notice the head-and-shoulders top defined by the August, September and October peaks. The pattern’s neckline matches major support, circa 249.
Moving to specific names, Tesla, Inc. is acting well technically.
As illustrated, the shares have tagged seven-month highs, edging atop resistance amid a volume uptick.
Tactically, the breakout point (796.50) pivots to first support. (Tuesday’s session low (796.57) registered nearby.)
Delving deeper, trendline support tracks the 50-day moving average, and is rising toward the former range bottom (763.50). A sustained posture higher signals a bullish bias.
Note Tesla’s quarterly results are due out Oct. 20.
EOG Resources, Inc. is a well positioned large-cap oil and gas name. (Yield = 1.8%.)
As illustrated, the shares have reached two-year highs, clearing resistance matching the June peak. The breakout point (87.80) pivots to well-defined support.
More broadly, the shares are well positioned on the two-year chart, rising from a massive cup-and-handle defined by the March 2020 and August 2021 lows.
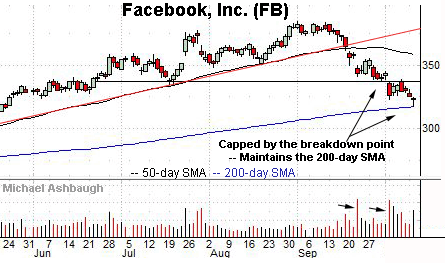
Finally, Facebook, Inc. has weathered a headline technical test.
Specifically, the shares have maintained the 200-day moving average, currently 317.38.
Tuesday’s session low (317.37) closely matched the 200-day to punctuate a dragonfly doji — (a bullish single-day reversal pattern) — amid increased volume.
More broadly, Facebook remains tenuously positioned based on today’s backdrop. See the recent volume spikes, fueling violations of major support. Also see the the 50-day moving average’s recent turn lower, consistent with a downtrend.
Tactically, upside follow-through atop the breakdown point (337.00) would place brakes on bearish momentum.


