Charting a failed technical test, S&P 500 stalls at the breakdown point
Focus: Transports and Financials reach major technical tests, Apple and IBM challenge key support, XLF, TRAN, AAPL, IBM, TNDM
U.S. stocks are mixed early Wednesday, vacillating after data signaling potentially slowing global economic growth.
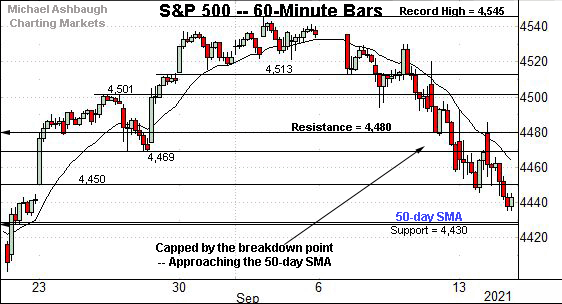
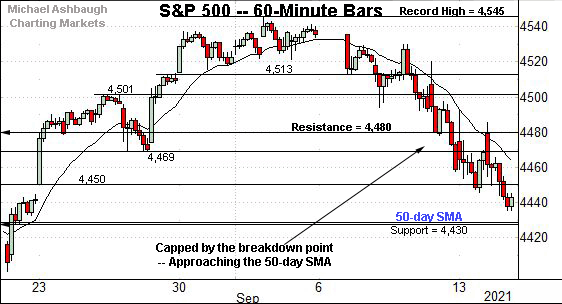
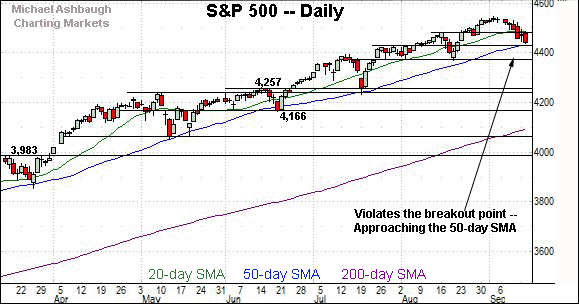
Against this backdrop, the S&P 500 has tagged three-week lows, punctuating a failed test of its breakdown point (4,480) from underneath. The S&P’s 50-day moving average is increasingly within view.
Editor’s Note: As always, updates can be directly accessed at chartingmarkets.substack.com.
Before detailing the U.S. markets’ wider view, the S&P 500’s hourly chart highlights the past four weeks.
As illustrated, the S&P continues to extend its September pullback.
This week’s downside follow-through punctuates a failed test of the breakdown point (4,480) from underneath. Shaky price action.
Delving deeper, the 50-day moving average, currently 4,431, closely matches the 4,430 support.
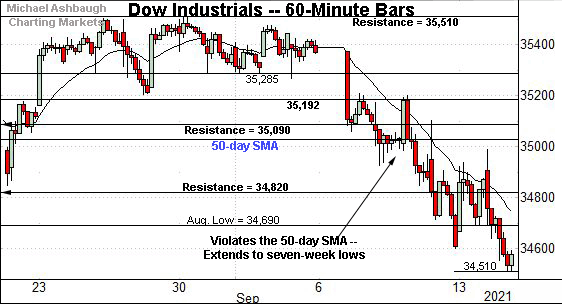
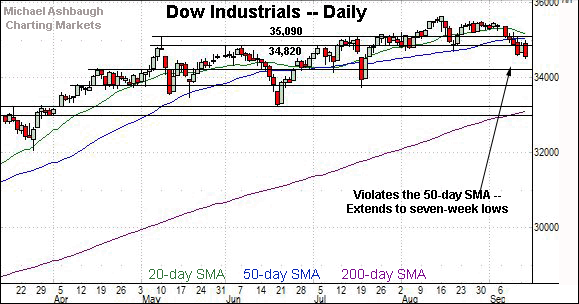
Meanwhile, the Dow Jones Industrial Average remains the weakest major benchmark.
As illustrated, the index has registered yet another seven-week low, placing distance firmly under the 50-day moving average.
From current levels, the August low (34,690) marks an overhead inflection point. A retest from underneath is currently underway.
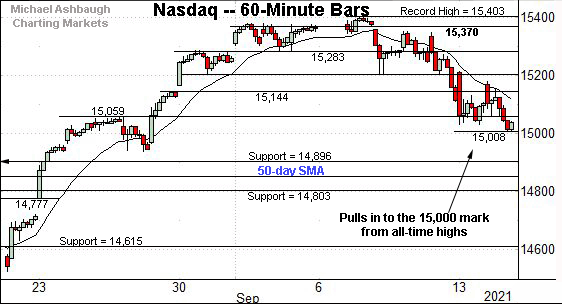
True to recent form, the Nasdaq Composite remains comparably stronger than the other benchmarks.
But here again, the index has extended its September pullback from record highs.
Tactically, the 15,000 mark is followed by the early-August peak (14,896), an area matching the Nasdaq’s first notable support.
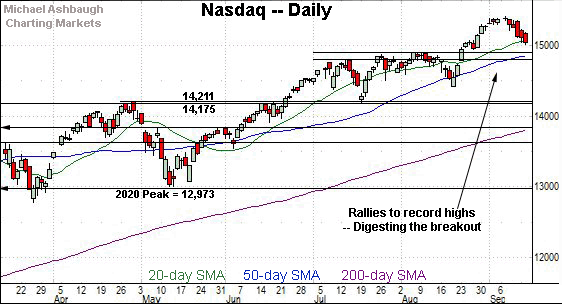
Widening the view to six months adds perspective.
On this wider view, the Nasdaq remains in September consolidation mode.
The index has pulled nearly 2.6% from its record high, as it vies Wednesday to avoid its first six-session losing streak since 2019.
Delving deeper, the breakout point (14,896) remains the Nasdaq’s first notable floor. The 50-day moving average, currently 14,853, is rising toward support.
As detailed previously, a sustained posture atop this area signals a bullish intermediate-term bias.
Looking elsewhere, the Dow Jones Industrial Average continues to diverge from the other benchmarks.
As illustrated, the index has tagged nearly two-month lows, notching four straight closes under the 50-day moving average.
Put differently, the index has yet to register a bullish reversal, and instead, has slightly extended its September downturn.
The Dow’s intermediate-term bias remains bearish, based on today’s backdrop.
Tactically, familiar overhead broadly spans from about 34,820 to 35,040. A rally atop this area would place the breaks on thus far modest bearish momentum.
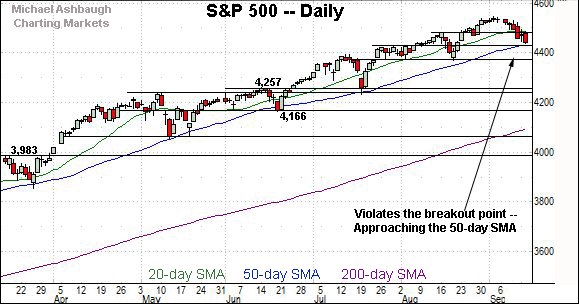
Meanwhile, the S&P 500 has also extended its September downturn.
To reiterate, the breakdown point (4,480) has capped the S&P’s early-week price action.
Conversely, the 50-day moving average, currently 4,431, closely matches next support (4,430).
The bigger picture
As detailed above, the major U.S. benchmarks remain in divergence mode.
Against this backdrop, the Nasdaq Composite remains relatively resilient, thus far staging a garden-variety pullback from recent record highs.
Meanwhile, the S&P 500 has violated its breakdown point (4,480) and failed the initial retest from underneath. More significant inflection points are increasingly within view.
Elsewhere, the Dow Jones Industrial Average has asserted a bearish-leaning intermediate-term bias, sustaining a posture under its 50-day moving average amid thus far lackluster rally attempts.
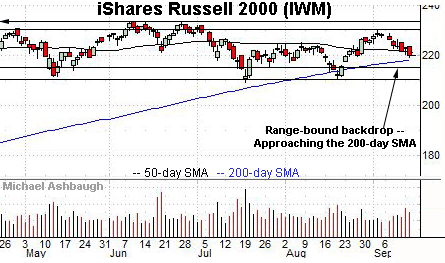
Moving to the small-caps, the iShares Russell 2000 ETF remains range-bound.
Within the range, the small-cap benchmark has ventured under its the 50-day moving average, currently 221.30.
Delving slightly deeper, the marquee 200-day moving average, currently 218.25, is within view.
Similarly, the SPDR S&P MidCap 400 ETF remains range bound.
Here again, the prevailing pullback places the MDY slightly under its 50-day moving average, currently 491.90.
Placing a finer point on the S&P 500, the index continues to pull in.
Tactically, the breakdown point (4,480) — detailed previously — has capped the S&P’s early-week rally attempt. Shaky price action.
Delving deeper, the 50-day moving average, currently 4,431, closely matches the 4,430 support.
(On a granular note, the prevailing downturn has effectively trended under the 20-hour moving average across each of the big three major benchmarks. Though technical damage has been limited, in the broad sweep, this is the hallmark of a respectable downtrend.)
More broadly, the S&P 500 has registered three-week lows, its worst levels since Aug. 20.
To reiterate, the 50-day moving average, currently 4,431, closely matches the S&P’s former range top (4,430).
Against this backdrop, prior bullish reversals have registered near one-month lows closely matching major support and the 50-day moving average. See the June, July and August lows — around 4,166, 4,257 and most recently 4,372.
To the extent the prevailing uptrend retains this character, the 4,430 area marks a likely candidate for the next intermediate-term market low. (Monday would mark a one-month low, if the S&P were to continue to hold near current levels.)
Delving deeper, likely last-ditch support matches the former range bottom (4,372) and the August low (4,367).
As detailed repeatedly, an eventual violation of the 4,370 area would mark a material “lower low” raising a technical caution flag.
Tactically, the S&P 500’s intermediate-term bias remains bullish barring a violation of the 4,370 area.
Watch List
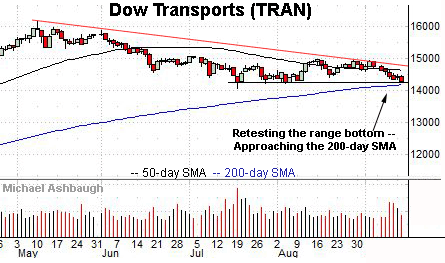
Drilling down further, the Dow Transports is testing major support.
Specifically, the group is challenging a five-month range bottom (14,243) pressured amid recently increased volume. The prevailing downturn originates from trendline resistance.
Delving slightly deeper, the 200-day moving average, currently 14,195, is rising toward support. The transports have not traded under the 200-day since July 2020.
Tactically, the group’s response to the 14,200-to-14,240 area should be a useful bull-bear gauge. An eventual violation would signal a primary trend shift, opening the path to potentially material downside follow-through.
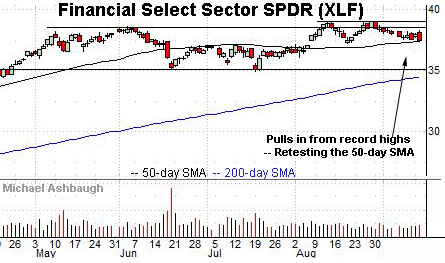
Meanwhile, the Financial Select Sector SPDR remains comparably resilient.
Still, the group is retesting its 50-day moving average, currently 37.40, a recent bull-bear inflection point.
Tactically, a slightly deeper floor matches the mid-August low (37.22). A violation would mark a “lower low” raising a question mark.
Combined, the transports and financials remain range-bound based on today’s backdrop. Still, key technical tests are in play, laying the groundwork for a potentially swift shift in the U.S. sector backdrop’s structure. The next several sessions may add color.
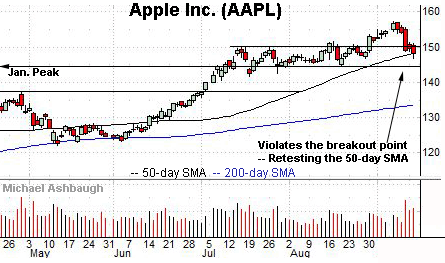
Moving to specific names, Dow 30 component Apple, Inc. has reached a notable technical test.
As illustrated, the shares have pulled in from record highs, pressured amid a familiar “sell-the-news” response to the company’s iPhone product launch.
In the process, the shares have violated the breakout point (149.80) — amid a volume spike — pulling in to retest the 50-day moving average, currently 148.17.
(Tuesday’s close registered just five cents above the 50-day, and Apple has ventured under the trending indicator early Wednesday.)
Delving deeper, notable support closely matches the January peak (145.10). An eventual violation would mark a material “lower low” raising an intermediate-term caution flag.
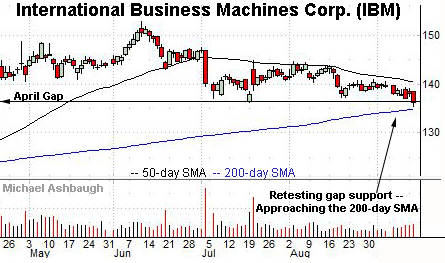
Looking elsewhere, Dow 30 component International Business Machines Corp. is tenuously positioned. (Yield = 4.8%.)
As illustrated, the shares are pressing a five-month range bottom closely matching the April gap (136.70). Recent weakness has been fueled by a sustained volume uptick.
Delving deeper, the marquee 200-day moving average, currently 134.80, is rising toward support. Tactically, an eventual violation would build on IBM’s early-July strong-volume downdraft, raising the flag to a primary trend shift.
Conversely, the 50-day moving average, currently 140.42, has marked an inflection point. An eventual close higher would place the shares on firmer technical ground.
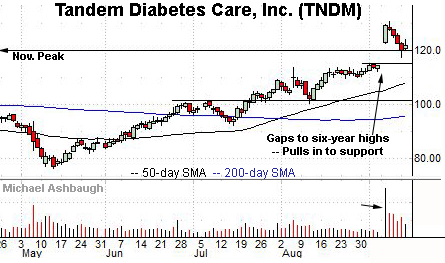
Finally, Tandem Diabetes Care, Inc. is a large-cap developer of insulin-delivery medical devices.
Earlier this month, the shares gapped to six-year highs, rising after an announcement that the company will be added to the S&P MidCap 400 Index, effective Sept. 20.
The subsequent pullback places the shares near the former range top (119.60) and 7.3% under the September peak. Tactically, a sustained posture atop gap support (114.40) signals a firmly-bullish bias.


