Charting a bullish reversal, S&P 500 maintains key support
Focus: Metals & Mining ETF holds 200-day average, Oil & Gas Exploration ETF's breakout, XME, XOP, COP, AN, EXPE
U.S. stocks are mixed early Monday, vacillating as the 10-year Treasury yield and crude-oil prices — (both detailed Friday) — extend potentially consequential September breakouts.
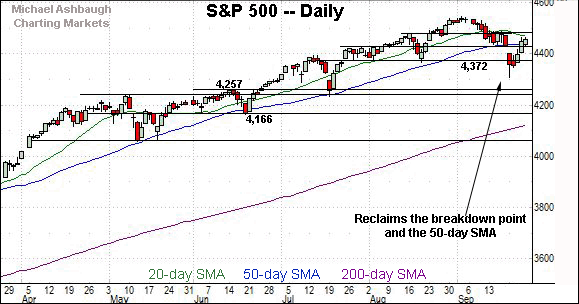
Against this backdrop, the S&P 500 has thus far sustained its bullish reversal atop two key technical levels — the 50-day moving average and the former breakdown point (4,430).
Editor’s Note: As always, updates can be directly accessed at chartingmarkets.substack.com.
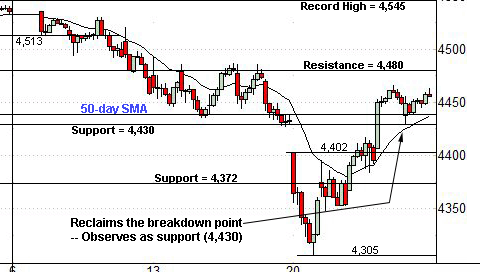
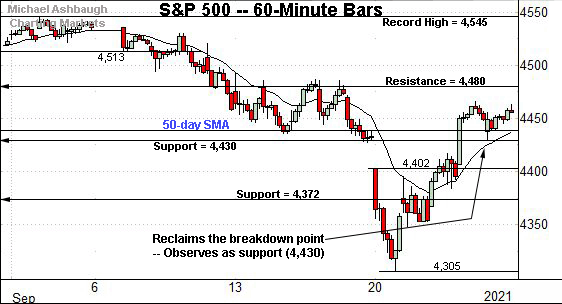
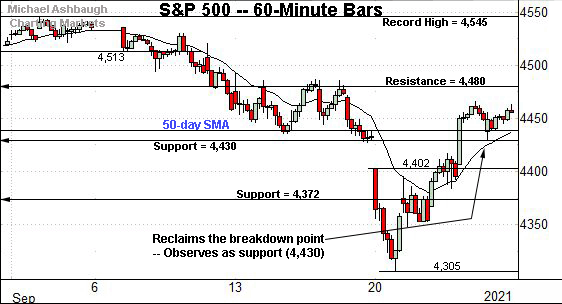
Before detailing the U.S. markets’ wider view, the S&P 500’s hourly chart highlights the past four weeks.
As illustrated, the S&P has sustained its reversal from the September low.
Tactically, important support matches the 50-day moving average, currently 4,442, and the breakdown point (4,430), detailed last week.
Friday’s session low (4,430) matched support amid a successful retest.
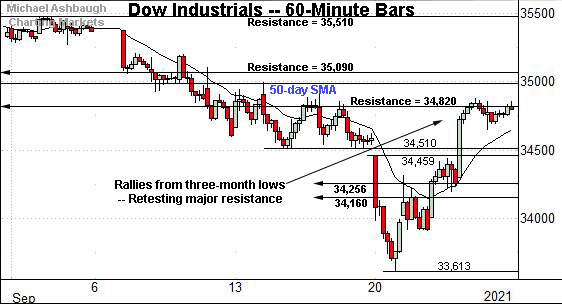
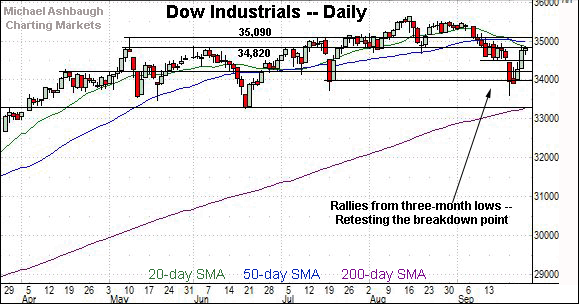
Meanwhile, the Dow Jones Industrial Average is pressing its breakdown point (34,820).
Though last week’s close (34,798) registered slightly lower, the Dow has ventured atop resistance with Monday’s strong start.
A retest of the 50-day moving average, currently 34,995, is underway early Monday.
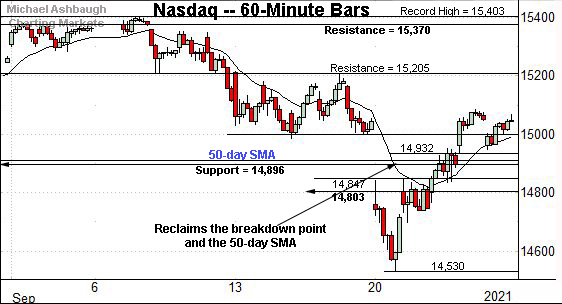
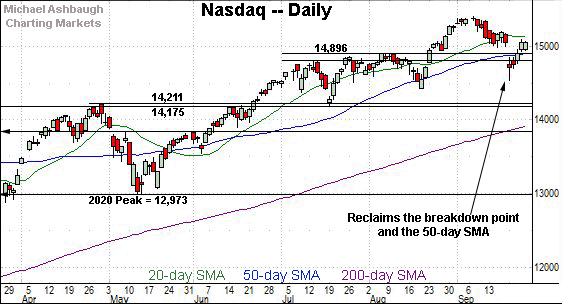
Against this backdrop, the Nasdaq Composite is vying Monday to sustain its bullish reversal.
Tactically, the 50-day moving average, currently 14,909, is followed by the former breakdown point (14,896), detailed repeatedly.
Monday’s early session high (14,985) closely matched the breakdown point. A session close under this level would raise a question mark.
Widening the view to six months adds perspective.
On this wider view, the Nasdaq is vying to sustain its bullish reversal.
To reiterate, the breakdown point (14,896) roughly matches the 50-day moving average, and remains a bull-bear inflection point.
The prevailing retest — across potentially the next several sessions — will likely add color. (The third quarter concludes Thursday.)
Looking elsewhere, the Dow Jones Industrial Average is challenging familiar resistance.
Tactically, the breakdown point (34,820) and the 50-day moving average, currently 34,995, have been in play early Monday.
Slightly more distant overhead matches the May peak (35,091). Sustained follow-through atop this area would signal a bullish intermediate-term bias.
Meanwhile, the S&P 500 is vying to sustain its rally atop two familiar levels.
The specific areas, detailed previously, match the 50-day moving average, currently 4,442, and the breakdown point (4,430). (Also see the hourly chart.)
The bigger picture
As detailed above, the major U.S. benchmarks are vying to sustain last week’s bullish reversal from the September low.
Against this backdrop, the S&P 500 has reclaimed its breakdown point (4,430) — a key bull-bear inflection point, detailed repeatedly — and subsequently observed this area as support. Constructive price action.
Moving to the small-caps, the iShares Russell 2000 ETF has strengthened versus the major U.S. benchmarks, maintaining a posture comfortably atop the August low.
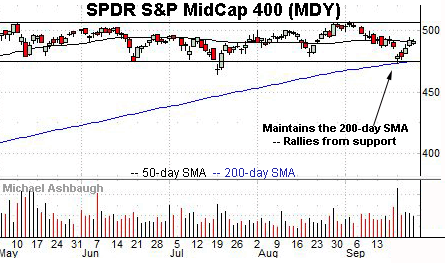
Meanwhile, the SPDR S&P MidCap 400 ETF remains range-bound, rising from major support closely matching the 200-day moving average.
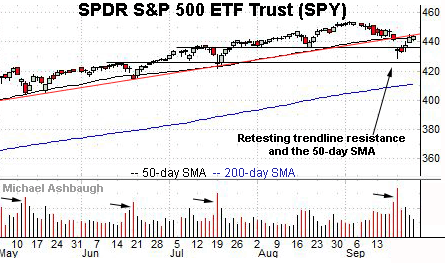
Looking elsewhere, the SPDR Trust S&P 500 ETF has sustained its rally from two-month lows, rising amid decreased volume, and thus far lukewarm internal strength.
Nonetheless, the SPY has registered consecutive closes back atop the 50-day moving average, currently 443.22. Eventual follow-through atop trendline resistance, circa 445, would incrementally strengthen the bull case.
Separately, recall that previous volume spikes — see the arrows — have punctuated intermediate-term lows.
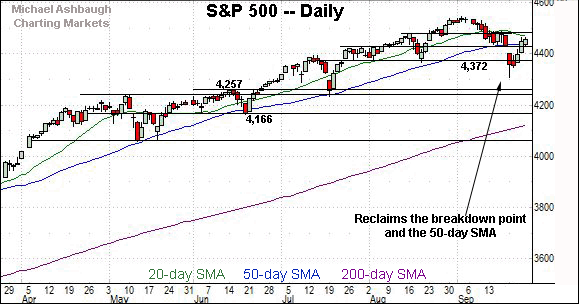
Placing a finer point on the S&P 500, the index has sustained its reversal atop the breakdown point (4,430), and the 50-day moving average, currently 4,442.
Friday’s session low (4,430) matched support to punctuate a successful retest from above. Constructive price action.
More broadly, the S&P 500’s rally attempt has filled the September gap.
The bullish reversal places the S&P atop its breakdown point (4,430) and the 50-day moving average, currently 4,442.
(On a granular note, the top of the gap (4,427) effectively matches the breakdown point.)
Beyond technical levels, the very early-week price action is consistent with healthy rotational market price action.
For instance, the financials and energy sectors have rallied sharply early Monday, rising amid a large-cap technology downturn.
Surging treasury yields and crude-oil prices — detailed Friday — have contributed to the rotation.
Against this backdrop, the S&P 500’s intermediate-term bias remains bullish-leaning to the extent it sustains a posture atop the breakdown point (4,430). The next several sessions — and Thursday’s third-quarter conclusion — will likely add color.
Watch List
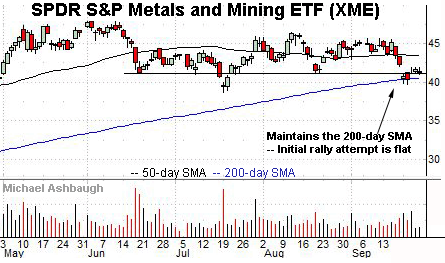
Drilling down further, the SPDR S&P Metals & Mining ETF seems to have weathered a key technical test.
Specifically, the group has maintained its 200-day moving average, currently 40.59, an area roughly matching the four-month range bottom (41.25).
Though the initial rally attempt registered as flat, the upturn has accelerated with Monday’s strong start, likely preserving a range-bound bias. At least for now.
Tactically, gap resistance (41.97) is followed by the 50-day moving average, currently 43.45. The pending retests from underneath should be a useful bull-bear gauge.
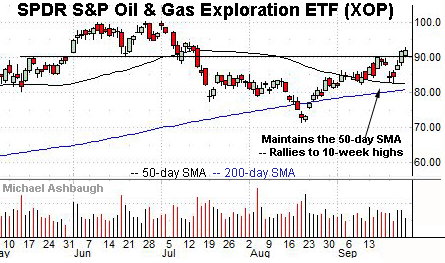
Meanwhile, the SPDR S&P Oil & Gas Exploration and Production ETF is acting well technically. (Yield = 1.4%.)
As illustrated, the group maintained its 50-day moving average amid last week’s market downturn, rising to tag 10-week highs. Tactically, the breakout point (89.90) pivots to support.
The prevailing upturn has registered amid surging crude-oil prices — as well as the Energy Select Sector SPDR’s (XLE) trendline breakout — both detailed Friday.
Consider that Brent crude has tagged its highest levels early Monday since 2018.
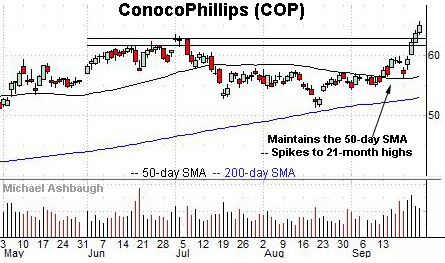
Moving to specific names, ConocoPhillips is a large-cap oil and gas name. (Yield = 2.8%.)
Technically, the shares have spiked from the 50-day moving average, a recent bull-bear inflection point.
Though near-term extended, and due to consolidate, the nearly straightline strong-volume spike is longer-term bullish. Tactically, a sustained posture atop the breakout point (62.90) signals a comfortably bullish bias.
Looking elsewhere, Expedia Group, Inc. is a large-cap name coming to life.
As illustrated, the shares have knifed atop trendline resistance — and the 200-day moving average — rising amid recent signs of waning virus cases.
Though near-term extended, the upturn punctuates an unusually strong two standard deviation breakout, likely laying the groundwork for longer-term follow-through. Tactically, the former range top (164.40) pivots to support.
Finally, AutoNation, Inc. is a well positioned large-cap auto retailer.
Technically, the shares have rallied to all-time highs, clearing resistance matching the August peak amid a down market.
By comparison, the immediate pullback has been flat, positioning the shares to build on the steep September rally.
Tactically, the breakout point (122.40) is closely followed by the post-breakout low (121.30). A sustained posture higher signals a bullish bias.

