Charting bullish momentum, S&P 500 spikes to 6,000 mark
Focus: Major U.S. benchmarks register powerful two standard deviation breakouts
Technically speaking, the major U.S. benchmarks have broken out, rising to tag all-time highs.
Amid the upturn, the November breakouts get high marks for style as measured by volume, breadth and internal strength. The charts below add color:
Editor’s Note: As always, updates can be directly accessed at chartingmarkets.substack.com.
Before detailing the U.S. markets’ wider view, the S&P 500’s hourly chart highlights the past four weeks.
As illustrated, the S&P 500 has knifed to all-time highs, rising to tag the 6,000 mark.
The subsequent bull flag — the tight range, hinged to the early-November rally — is a continuation pattern, laying the groundwork for potential upside follow-through.
Tactically, near-term support (5,960) is followed by the firmer breakout point (5,878).
Meanwhile, the Dow Jones Industrial Average has also broken out, rising to tag record highs.
And here again, the initial selling pressure near the range top has been flat. Bullish price action. Tactically, the 43,830 area marks a near-term floor.
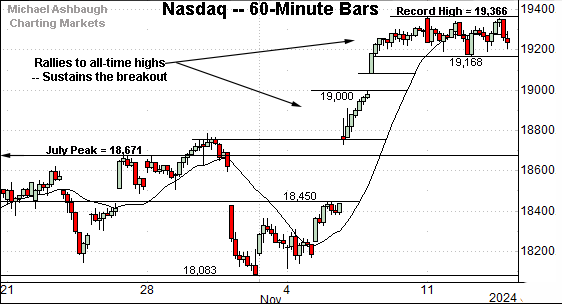
Against this backdrop, the Nasdaq Composite has also knifed to record territory.
The subsequent tight range signals still muted selling pressure despite the steep rally to all-time highs.
Tactically, the prevailing range bottom (19,168) is closely followed by gap support precisely matching the 19,000 mark.
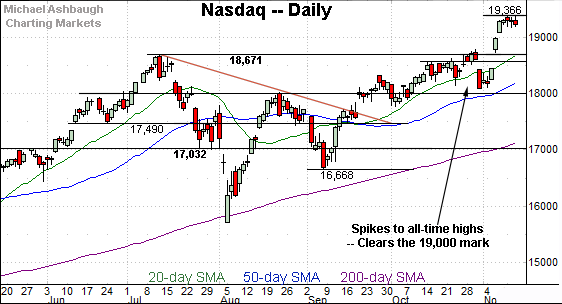
Widening the view to six months adds perspective.
On this wider view, the Nasdaq has taken flight, rising to clear the 19,000 mark for the first time on record.
The subsequent pullback has been flat, signaling an absence of sellers despite the unusually aggressive 3.5%+ November breakout.
Generally speaking, when sellers are absent, prices rise to attract incremental sellers.
Tactically, the 19,000 mark is followed by the firmer breakout point (18,671).
Looking elsewhere, the Dow Jones Industrial Average has knifed to all-time highs, rising to clear the 44,000 mark for the first time on record.
In its case, the steep November spike marks an aggressive 2.5%+ breakout. (As a general rule, breakouts approaching 1.0% would be sufficient to confirm the prevailing trend.)
Tactically, the breakout point (43,325) pivots to well-defined support.
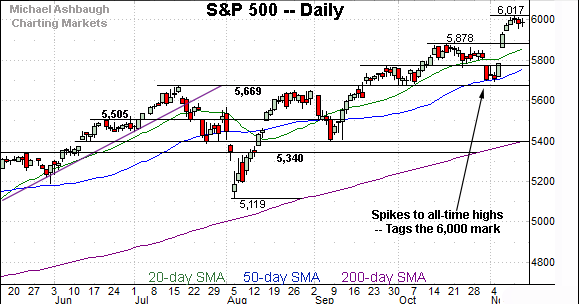
Meanwhile, the S&P 500 has also spiked to record territory, rising to tag the 6,000 mark.
Its November rally marks a strong 2.0%+ breakout, confirming the primary uptrend.
Tactically, the breakout point (5,878) marks notable support. (Also see the hourly chart.
The bigger picture
As detailed above, the major U.S. benchmarks have taken flight, rising to tag all-time highs.
Amid the upturn, the November rallies have been fueled by powerful bullish momentum in the form of two standard deviation breakouts across the big three U.S. benchmarks. (Each index has registered at least two closes atop the 20-day volatility bands across a narrow four-session window.)
So while near-term extended — and a sideways consolidation phase is already underway — the powerful November spikes likely lay the groundwork for longer-term follow-through.
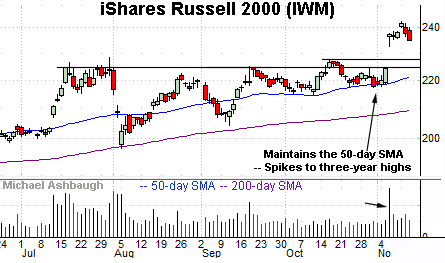
Moving to the small-caps, the iShares Russell 2000 ETF (IWM) has also broken out.
Specifically, the small-cap benchmark has knifed to three-year highs, rising amid a volume spike after the U.S. election.
The prevailing upturn punctuates an extended range, underpinned by the 50-day moving average.
Tactically, the breakout point — the 224.20-to-226.70 area — marks notable support. The 50-day moving average is rising toward the breakout point.
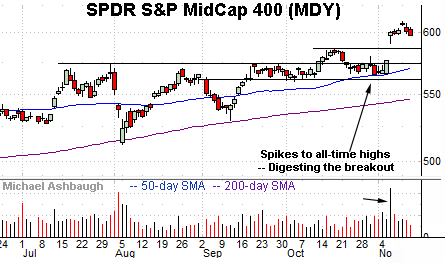
Meanwhile, the SPDR S&P MidCap 400 ETF (MDY) has gapped to all-time highs, also rising amid a volume spike.
More immediately, the prevailing pullback has been flat, fueled by decreased volume.
Tactically, the 585.50 and 591.10 areas mark notable nearby floors.
More broadly, the November breakout builds on a double bottom defined by consecutive tests of the 200-day moving average at the August and September lows.
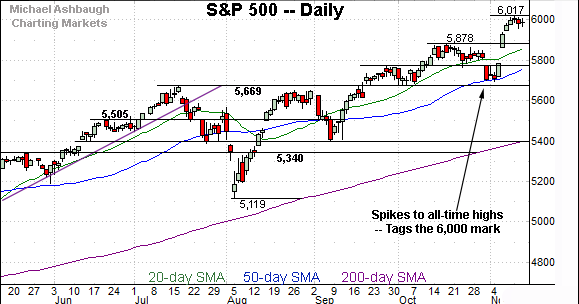
Returning to the S&P 500, its bigger-picture backdrop remains firmly bullish.
As illustrated, the S&P has knifed to tag the 6,000 mark, rising from a pre-election test of the 50-day moving average.
The prevailing upturn punctuates a bullish island reversal, defined by the late-October gap lower and early-November gap higher, encompassing four sessions underpinned by the 50-day moving average. (The island reversal is a high-reliability pattern, though its reliability increases with its duration and the gaps’ size. The pattern illustrated does not stand out as especially impressive, though the actual November breakout has been emperically decisive.)
Against this backdrop, the November breakout point (5,878) pivots to well-defined support.
On further weakness, the 50-day moving average, currently 5,762, is rising toward gap support (5,784). (Also see the hourly chart.)
And delving deeper, the September breakout point — the 5,670 area — likely marks last-ditch support.
As always, it’s not just what the markets do, it’s how they do it.
But generally speaking, the S&P’s intermediate-term bias remains bullish barring a violation of the 5,670 area. Beyond specific levels, the November breakouts get high marks for style as measured by volume, breadth and internal strength.
Also see Oct. 30: Charting a pulling-teeth breakout attempt, Nasdaq edges to all-time highs.


