Charting (another) market whipsaw, S&P 500 hesitates at key trendline
Focus: Major U.S. benchmarks rattle the range top amid Dow industrials' pending golden cross
Technically speaking, the major U.S. benchmarks have rattled the range top, rising amid a second market whipsaw in as many weeks.
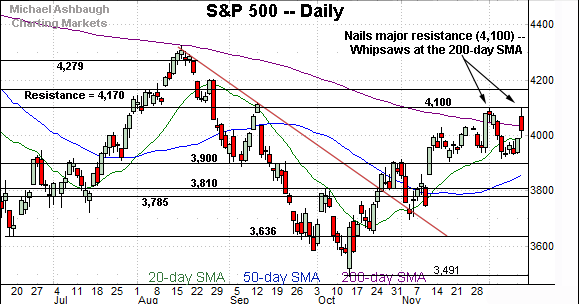
Against this backdrop, the S&P 500 has nailed major resistance (4,100), a level matching an important trendline hinged to its all-time high. This area marks a potentially consequential technical test, and has thus far concluded with a bull-bear stalemate.
Editor’s Note: As always, updates can be directly accessed at https://chartingmarkets.substack.com.
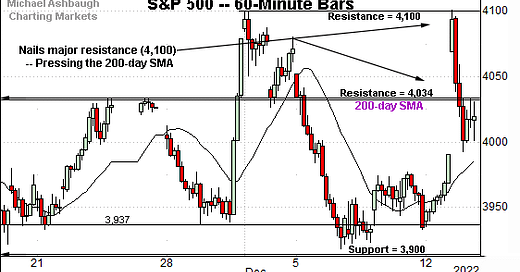
Before detailing the U.S. markets’ wider view, the S&P 500’s hourly chart highlights the past four weeks.
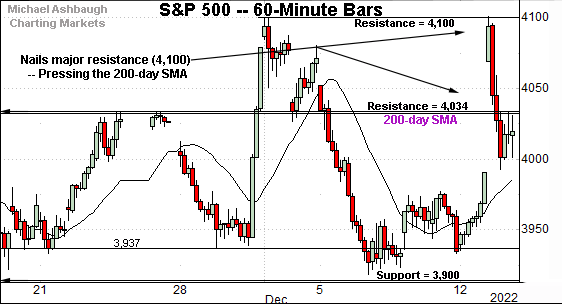
As illustrated, the S&P has nailed its range top (4,100).
The week-to-date peak (4,100.9) has closely matched the Dec. 1 peak (4,100.5).
Combined, the 4,100 mark has capped two aggressive market spikes. The late-November straightline spike — fueled by well received Federal Reserve policy langauge — and this week’s massive gap higher amid tamer-than-expected inflation data.
Within the range, the S&P 500 is pressing its 200-day moving average, currently 4,032.
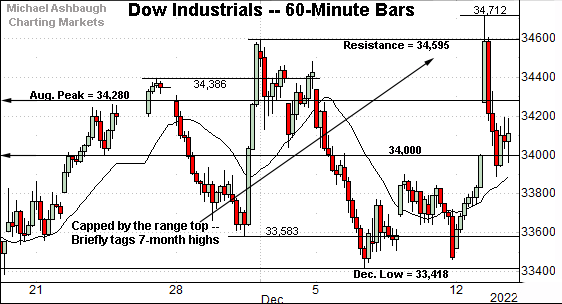
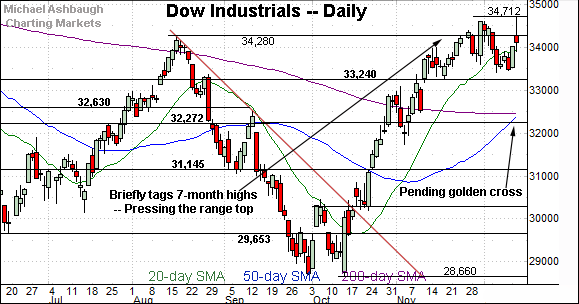
Similarly, the Dow Jones Industrial Average has tagged its range top.
Here again, the early-December peak (34,595) has effectively capped this week’s inflation-data-fueled spike.
Within the range, the August peak (34,280) marks an inflection point, an area better illustrated on the daily chart.
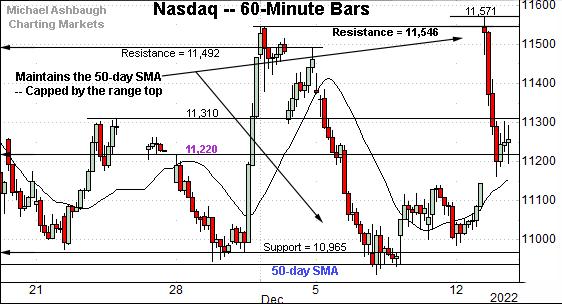
Against this backdrop, the Nasdaq Composite has also tagged its range top.
Wednesday’s session open (11,542) effectively matched the early-December peak (11,546) and selling pressure surfaced.
Combined, the early-December Fed-induced peaks mark well-defined hurdles across the major U.S. benchmarks.
Widening the view to six months adds perspective.
On this wider view, the Nasdaq remains range-bound.
Against this backdrop, the November peak (11,492) remains an inflection point. (The December closing high (11,482) registered nearby and marks the best close since September.)
Broadly speaking, follow-through atop the 11,490-to-11,550 area would mark a “higher high” confirming the intermediate-term uptrend.
Conversely, the 50-day moving average, currently 10,945, closely matches the range bottom. An eventual violation of this area would raise an intermediate-term a caution flag.
Looking elsewhere, the Dow Jones Industrial Average remains the strongest benchmark.
In fact, the index has briefly tagged a seven-month high.
Tactically, the August peak (34,280) remains an overhead inflection point.
More broadly, notice the pending golden cross — or 50-day/200-day moving average crossover — an event that may signal Wednesday to the extent the Dow registers a positive close. Though frequently a lagging indicator, the crossover signals the intermediate-term uptrend has overtaken the longer-term trend.
Meanwhile, the S&P 500 has once again balked at major resistance (4,100).
Separately, the prevailing upturn marks the second December test of the 200-day moving average — important technical territory — as detailed in the next section.
The bigger picture
Collectively, the major U.S. benchmarks have rattled the range, rising amid a second market whipsaw in as many weeks.
Still, the net result, thus far, is a bull-bear stalemate. Each index has tagged its range top, and selling pressure has surfaced. (See the hourly charts.)
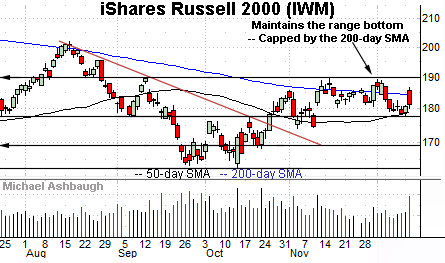
Moving to the small-caps, the iShares Russell 2000 ETF (IWM) has weathered a recent technical test.
Specifically, the small-cap benchmark has maintained its range bottom, an area matching the 50-day moving average and the October breakout point (177.30).
More immediately, notice this week’s whipsaw at the 200-day moving average, currently 184.25, amid increased volume after well received consumer inflation data. (Another bull-bear stalemate.)
Meanwhile, the SPDR S&P MidCap 400 ETF (MDY) remains stronger than the Russell 2000.
As illustrated, the mid-cap benchmark has sustained a break atop its 200-day moving average, currently 449.54, an area closely matching the breakout point (448.40).
The prevailing upturn punctuates an extended test of major support at the December low. Constructive price action.
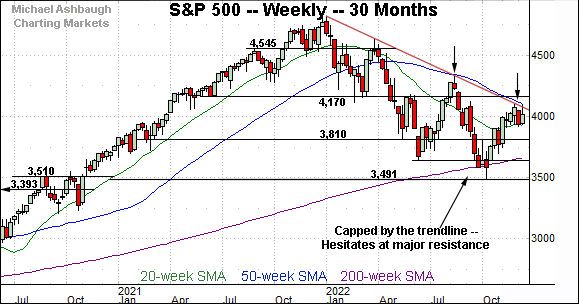
Returning to the S&P 500, this next chart is a weekly view spanning 30 months. Each bar on the chart represents one week.
As illustrated, the S&P 500 is back for another crack at trendline resistance, a level tracking the 50-week moving average, currently 4,104.
Recall the trendline is hinged to the S&P’s all-time high, established Jan. 4, 2022.
Against this backdrop, the week-to-date peak (4,101) has matched major resistance, an area also detailed below. (See the Dec. 6 review, for added detail regarding the weekly chart.)
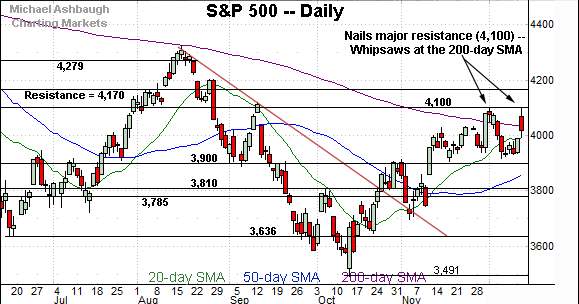
Returning to the S&P 500’s six-month view adds perspective.
As illustrated, the prevailing upturn marks a second December test of the 200-day moving average, as well as a trendline test on the weekly chart, detailed previously.
As reference, the August peak marked a failed test of the 200-day moving average, and a failed trendline test on the weekly chart.
Against this backdrop, eventual follow-through atop the 4,100 mark would do three things:
Mark a “higher high” confirming the intermediate-term recovery attempt.
Punctuate follow-through atop the 200-day moving average, raising the flag to a primary trend shift.
Dovetail with a trendline breakout on the weekly chart, also consistent with a longer-term trend shift.
So tactically, the pending selling pressure near the 4,100 mark, or lack thereof, is worth tracking. The chances of a breakout improve to the extent the S&P 500 holds relatively tightly to this area.
Conversely, the 3,900 mark remains a downside inflection point. The S&P 500’s rally attempt is intact barring a violation.
Beyond specific levels, the response to the Federal Reserve’s policy directive — potentially across the next several sessions — will likely add color. (The Fed’s statement may be the last true market catalyst through year-end.) No new setups today.
Editor’s Note: The next review will be published Tuesday, Dec. 20.

