Charting a volatile, and still largely bearish, bigger-picture backdrop
Focus: Gold's stealth breakout attempt, Pockets of sector strength and weakness, GLD, XLE, XLV, TRAN, XLF, GOOGL
Technically speaking, the major U.S. benchmarks continue to whipsaw amid largely bearish bigger-picture price action.
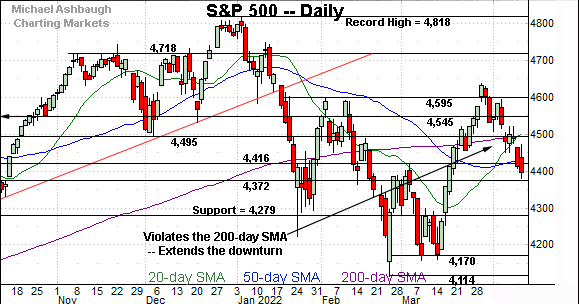
Against this backdrop, the S&P 500 has placed distance under its 200-day moving average, currently 4,494, a widely-tracked bull-bear inflection point.
Editor’s Note: As always, updates can be directly accessed at https://chartingmarkets.substack.com.
Before detailing the U.S. markets’ wider view, the S&P 500’s hourly chart highlights the past four weeks.
As illustrated, the S&P has tagged three-week lows, placing distance under the 200-day moving average.
Tactically, initial resistance (4,416) is closely followed by the 50-day moving average, currently 4,422.
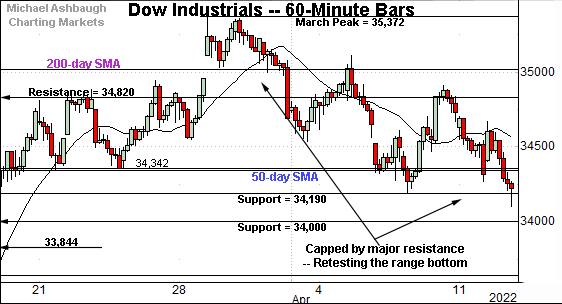
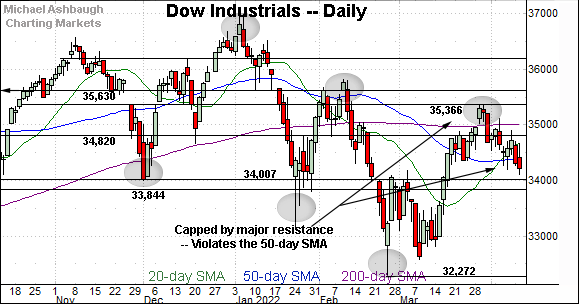
Meanwhile, the Dow Jones Industrial Average is pressing its range bottom.
From current levels, the 50-day moving averge, currently 34,335, marks an overhead inflection point.
More broadly, the prevailing pullback originates from major resistance (35,366) an area detailed on the daily chart.
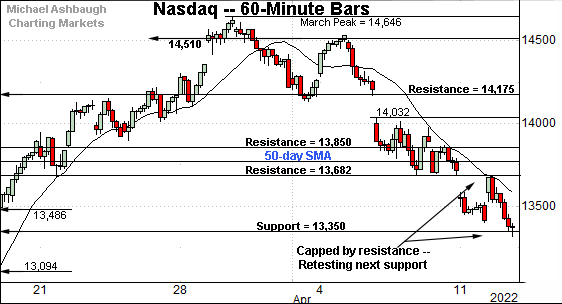
Against this backdrop, the Nasdaq Composite has extended its downturn.
Tactically, the index has violated next support (13,682) — detailed previously — and observed this area as resistance. (See Monday’s review.)
Tuesday’s session high (13,685) registered nearby.
Delving deeper, the Nasdaq’s next floor (13,350) is also detailed on the daily chart below.
Wednesday’s early session low (13,353) registered nearby.
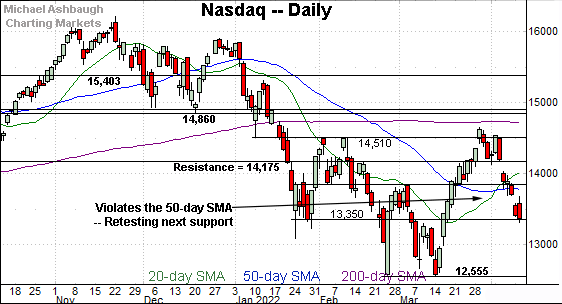
Widening the view to six months adds perspective.
On this wider view, the Nasdaq has extended its downturn to next support (13,350), an area detailed repeatedly.
The quality of the rally attempt from this area will likely add color.
Slightly more broadly, the prevailing downturn places the Nasdaq back under its former breakout point (13,850) and the 50-day moving average.
The violation of this area — effectively on the first test — signals a bearish-leaning intermediate-term bias.
Looking elsewhere, the Dow Jones Industrial Average has also extended its April downturn.
The prevailing pullback places it under the 50-day moving average.
More broadly, the index has established a series of “lower highs” and “lower lows” consistent with a broader downtrend.
From current levels, the 34,000 area marks a notable floor.
Meanwhile, the S&P 500 has violated a key inflection point.
The specific area matches the 200-day moving average, currently 4,494, and the December low (4,495).
Last week’s close (4,488) registered slightly under support, and selling pressure has surfaced.
The bigger picture
As detailed above, the prevailing bigger-picture backdrop remains bearish, on balance.
On a headline basis, the S&P 500 and Nasdaq Composite have violated bull-bear inflection points — S&P 4,495 and Nasdaq 13,850 — as well as the 50-day moving average. (See the daily charts.)
Moving to the small-caps, the iShares Russell 2000 ETF has also staged an April downturn.
Though the small-cap benchmark is hugging the trendline, it remains cappped by the 50-day moving average, currently 201.60. Shaky price action. (See the January peak.)
Follow-through atop these areas would mark progress.
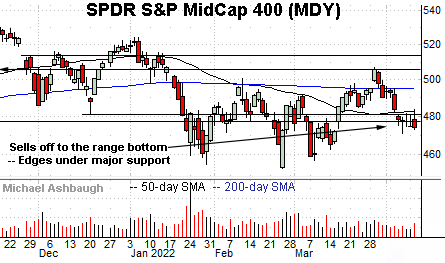
Meanwhile, the SPDR S&P MidCap 400 ETF continues to test major support.
The specific area matches its former range bottom, circa 477.00. Last week’s close (477.03) effectively matched support.
Here again, the MDY has also asserted a posture under the 50-day moving average, currently 482.52.
Returning to the S&P 500, its backdrop remains challenging, but is at least somewhat straighforward from a technical standpoint.
Tactically, major resistance now “spans” from 4,494 to 4,495, levels matching the 200-day moving average and the December low.
This marks a widely-tracked bull-bear inflection point, and a sustained posture lower signals a bearish-leaning intermediate- to longer-term bias.
Watch List
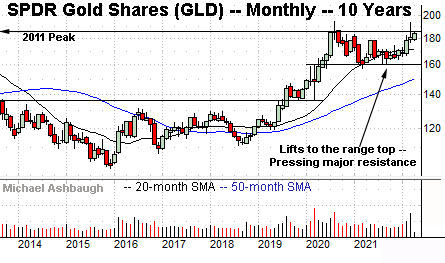
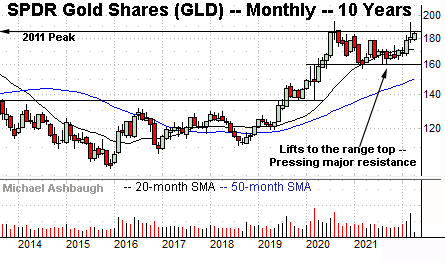
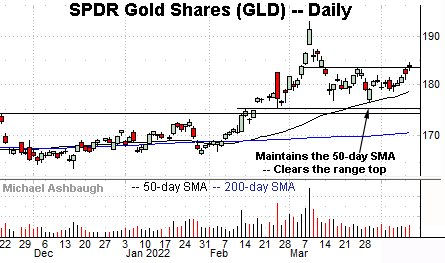
Drilling down further, the SPDR Gold Shares ETF (GLD) is acting well technically.
The shares initially spiked about two months ago, knifing to 20-month highs amid a sustained volume increase.
The subsequent pullback has been orderly, in the broad sweep, and underpinned by the 50-day moving average.
More broadly, the shares are approaching major resistance illustrated on the 10-year chart. Overhead inflection points match the 2011 peak (185.85) and the July 2020 close (185.43) the highest monthly close on record.
The prevailing upturn punctuates a nearly two-year range — a coiled spring, of sorts, illustrated on the 10-year chart — laying the groundwork for potentially material upside follow-through on a breakout. (Also see the March volume spike, illustrated on the monthly chart.)
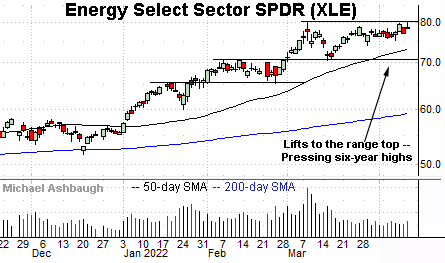
Moving to U.S. sectors, the Energy Select Sector SPDR (XLE) is technically well positioned. (Yield = 3.9%.)
As illustrated, the group is challenging six-year highs, rising from a successful test of support at the March low.
More broadly, the prevailing range top matches major resistance illustrated on the five-year chart. Overhead inflection points match the 2018 peak (79.42) and the March 2022 peak (80.22).
On a granular note, see the group’s sustained volume increase, spanning two years, and originating from the pandemic low. It’s unlike any other sector. Bullish momentum is intact for now.
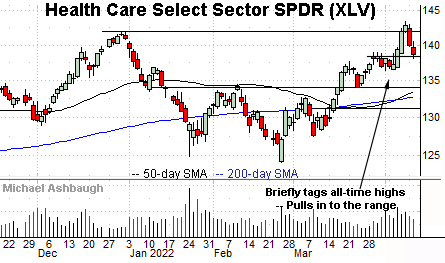
Elsewhere, the Health Care Select Sector SPDR (XLV) is also rising amid an otherwise down market. (Yield = 1.4%.)
Earlier this month, the group briefly tagged all-time highs, clearing resistance matching the December peak.
The subsequent pullback has been fueled by decreased volume, placing the group near support (138.40) and 3.5% under the April peak.
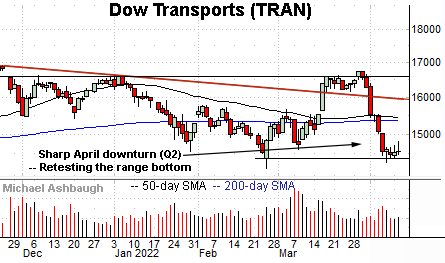
Moving to pockets of weakness, the Dow Transports (TRAN) have turned lower, pressured at least partly amid an inflationary headwind — rising energy and labor costs.
(Meanwhile, the energy sector is currently benefiting from inflation, and the health care sector is relatively insulated from inflation.)
Technically, an extended test of the range bottom — the 14,375 area — remains underway. The response to this area should be a useful bull-bear gauge.
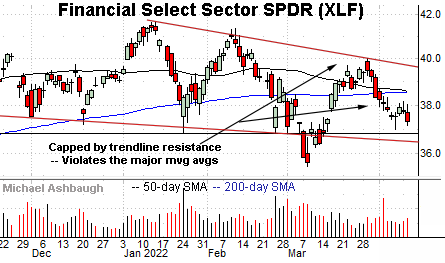
Meanwhile, the Financial Select Sector SPDR (XLF) remains range-bound, though the prevailing backdrop raises caution flags.
Consider that the early-March downdraft was fueled by increased volume, and punctuated by a ligher-volume rally attempt, capped by trendline resistance.
Tactically, the range bottom marks a notable floor, matching the January low (36.82) and February low (36.80). The pending retest will likely add color.
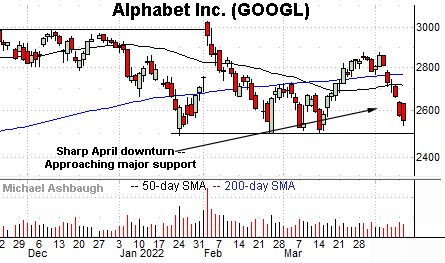
Concluding with one influential name, Alphabet, Inc. (GOOGL) — the parent company of Google — has turned lower.
The April downturn places the shares under the 50- and 200-day moving averages.
Tactically, major support rests in the 2,490-to-2,499 area, levels matching the January and February lows.
As always, major support is frequently violated on the third or fourth independent test. The pending retest will likely add color.

