
Charting a stealth breakout attempt, S&P 500 briefly tags record high
Focus: Small- and mid-caps assert holding pattern as Nasdaq notches two-month high

Technically speaking, the bigger-picture backdrop remains bullish even amid a jagged 2025 start.
On a headline basis, the S&P 500 has tagged a nominal record high, opening the path to an upside target (6,425). Elsewhere, the Nasdaq Composite and Dow industrials remain range-bound, though each benchmark rests within striking distance of all-time highs. The charts below add color:
Editor’s Note: As always, updates can be directly accessed at chartingmarkets.substack.com.
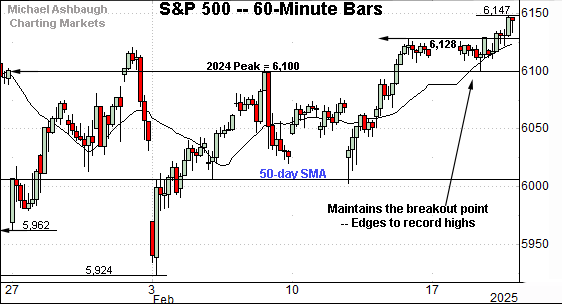
Before detailing the U.S. markets’ wider view, the S&P 500’s hourly chart highlights the past four weeks.
As illustrated, the S&P 500 has tagged a nominal record high.
The prevailing upturn punctuates a tight three-session range, underpinned by the breakout point (6,100). Delving deeper, the 50-day moving average, currently 6,010, marks an inflection point, an area also detailed on the daily chart.
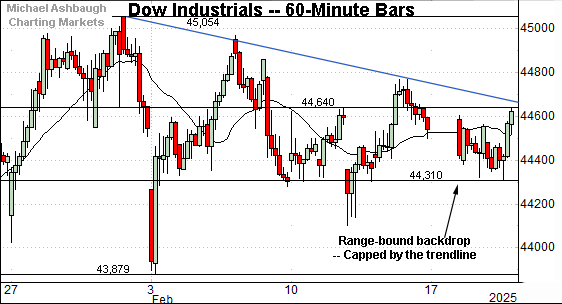
Meanwhile, the Dow Jones Industrial Average is lagging behind the other benchmarks.
As illustrated, the prevailing range is capped by a trendline hinged to the January peak. Tactically, the 44,640 area marks an overhead inflection point.

Against this backdrop, the Nasdaq Composite has sustained a modest break to two-month highs.
The prevailing upturn punctuates a jagged one-month range, hinged to the 50-day moving average.
Delving deeper, recall the 19,140-to-19,200 area marks significant support, an area also detailed below.
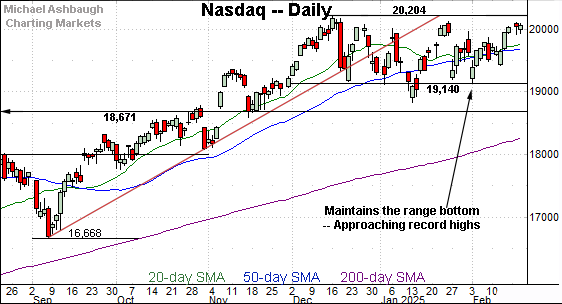
Widening the view to six months adds perspective.
On this wider view, the Nasdaq is traversing a jagged, but increasingly well-defined, two-month range.
The range top matches its all-time high (20,204) established late last year.
Conversely, the range bottom marks major support (19,140) an area also detailed on the hourly chart. The Nasdaq’s intermediate-term bias remains bullish barring a violation of this area.
(On a granular note, the 50-day moving average effectively bisects the Nasdaq’s range amid a bullish continuation pattern. The prevailing backdrop favors an eventual break higher, building on the steep late-2024 rally to reach the two-month range.)
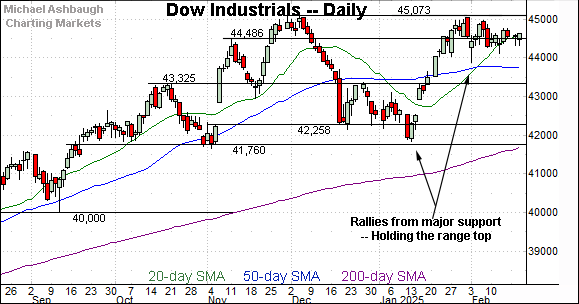
Looking elsewhere, the Dow Jones Industrial Average has registered flattish February price action.
Tactically, resistance narrowly spans from 45,054 to 45,073 levels defining the 2025 peak and 2024 peak respectively. (Also see the hourly chart.)
More broadly, the prevailing upturn originates from the Dow’s four-month range bottom. The steep January rally, and subsequent tight range, signal muted selling pressure, laying the groundwork for a potential breakout.
Meanwhile, the S&P 500 has edged to record territory.
The prevailing upturn originates from the 50-day moving average, an area the S&P has maintained on a closing basis since the mid-January break higher.
The bigger picture
As detailed above, the U.S. benchmarks’ bigger-picture backdrop remains bullish.
On a headline basis, the S&P 500 has tagged all-time highs, edging slightly above the January and December peaks. Meanwhile, the Nasdaq Composite and Dow industrials remain range-bound, though each benchmark holds within striking distance of record territory.
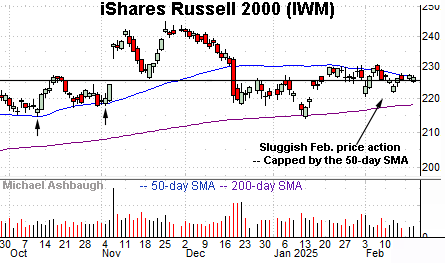
Moving to the small-caps, the iShares Russell 2000 ETF (IWM) continues to largely tread water.
Amid the sluggishness, the small-cap benchmark remains capped by its 50-day moving average, a widely-tracked intermediate-term trending indicator. Recall the 50-day previously underpinned the late-2024 price action. (See the Oct. and Nov. lows.)

Meanwhile, the SPDR S&P MidCap 400 ETF (MDY) remains slightly stronger than the small-caps.
As illustrated, the mid-cap benchmark has maintained its January breakout point, an area that has underpinned the February price action. Separately, the mid-cap benchmark has not strayed too far from its 50-day moving average since the initial breakout.
More broadly, the small- and mid-caps both maintained the 200-day moving average at the January low. The primary uptrends are intact.

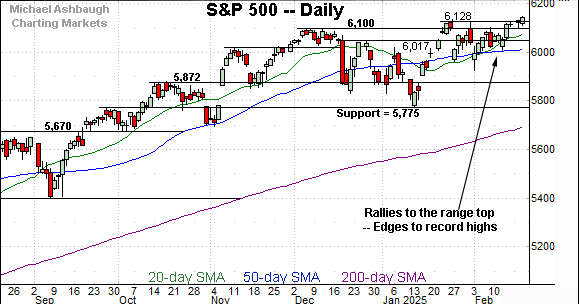
Returning to the S&P 500, the index is acting well technically.
As illustrated, the index has edged to record territory, rising from a jagged four-week range underpinned by the 50-day moving average.
Tactically, an intermediate-term target continues to project to the 6,425 area.
Conversely, the 2024 peak (6,100) marks a notable floor and is followed by the 50-day moving average, currently 6,010.
Delving deeper, the Fed-induced inflection point (5,872) is followed by last-ditch support at 5,775, an area matching the post-election low. (See the Jan. 8 review.)
As always, it’s not just what the markets do, it’s how they do it. But generally speaking, the S&P 500’s intermediate-term bias remains bullish barring a violation of the 5,775 area.
Also see Feb. 6: Charting a market whipsaw, Nasdaq aborbs Deepseek-fueled downdraft.