Charting a May breakout attempt, S&P 500 challenges key resistance
Focus: Consumer staples digest break to record highs, Advanced Micro Devices retests key trendline, XLP, AMD, FOUR, ROST, XEC
Technically speaking, the major U.S. benchmarks are starting May amid a still comfortably-bullish bigger-picture backdrop.
Editor’s Note: As always, updates can be accessed at chartingmarkets.substack.com. Your smartphone smartphone can also access updates at the same address, chartingmarkets.substack.com.
Before detailing the U.S. markets’ wider view, the S&P 500’s hourly chart highlights the past four weeks.
As illustrated, the S&P continues to whipsaw near record highs.
Tactically, Friday’s session low (4,174.9) closely matched the range bottom (4,176), detailed previously.
More immediately, the S&P has ventured back atop familiar resistance (4,191) early Monday. A jagged breakout attempt remains underway.
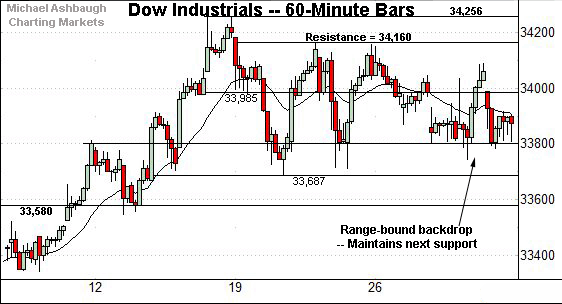
True to recent form, the Dow Jones Industrial Average remains range-bound.
Within the range, the 33,800 area has marked a recent inflection point.
Conversely, the prevailing range top (34,160) is followed by the Dow’s record close (34,200.67) and absolute record peak (34,256.75).
Against this backdrop, the Nasdaq Composite has reversed from last week’s truly fleeting record high.
Tactically, the range top (14,062) is followed by an inflection point closely matching the Feb. peak (14,175).
Widening the view to six months adds perspective.
On this wider view, the Nasdaq remains capped by its range top (14,175).
Nonetheless, last week’s bearish single-day reversal has thus far been punctuated by limited downside follow-through. The index is holding its range top in the broad sweep.
Tactically, the prevailing range bottom, circa 13,700, is followed by the March peak (13,620) and the flatlining 50-day moving average, currently 13,513. A sustained posture atop this area signals a bullish intermediate-term bias.
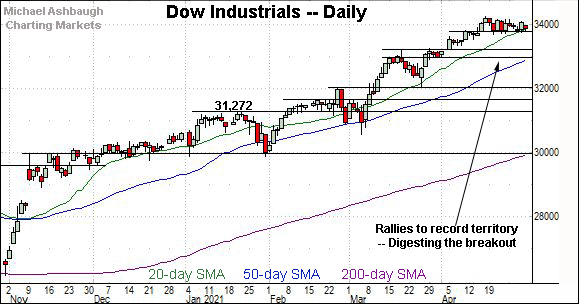
Looking elsewhere, the Dow Jones Industrial Average has largely flatlined against a still comfortably-bullish backdrop.
Tactically, near-term support (33,800) is followed by prevailing range bottom (33,687), areas also illustrated on the hourly chart.
Meanwhile, the S&P 500’s grinding-higher breakout attempt remains underway.
The index has whipsawed of late near its range top (4,191), an area better illustrated on the hourly chart. (Monday’s early session low (4,192) has registered nearby.)
The bigger picture
Collectively, the U.S. benchmarks’ bigger-picture technical backdrop remains broadly bullish as the worst six-month seasonal period kicks off.
Moving to the small-caps, the iShares Russell 2000 ETF remains range-bound.
Within the range, the 50-day moving average, currently 223.26, marks an inflection point.
Separately, the range top roughly matches the Feb. peak (230.30) and has marked a hurdle.
Meanwhile, the SPDR S&P MidCap 400 remains incrementally stronger, digesting a modest late-April break to record territory.
Placing a finer point on the S&P 500, the index continues to hug its range top, an area matching familiar resistance (4,191).
Tactically, Friday’s session low (4,174.9) closely matched near-term support (4,176), detailed previously.
A jagged breakout attempt remains underway.
More broadly, the S&P’s mid-April range bottom (4,118) is followed by an inflection point matching its former projected target (4,085).
Delving deeper, the S&P’s 50-day moving average, currently 4,008, is followed by the breakout point (3,983). Broadly speaking, a sustained posture atop the 3,980-to-4,000 area signals a bullish intermediate-term bias.
Monday’s Watch List
Drilling down further, consider the following sectors and individual names:
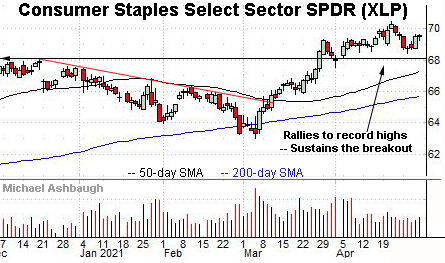
To start, the Consumer Staples Select Sector SPDR is acting well technically. (Yield = 2.7%.)
The group initially spiked five weeks ago, knifing to record highs. The upturn punctuated an early-March trendline breakout.
More immediately, the relatively tight April range is a bullish continuation pattern.
Tactically, the breakout point (68.00) is followed by the ascending 50-day moving average, a recent bull-bear inflection point. A sustained posture higher signals a bullish bias. (Note the former trendline tracked the 50-day moving average.)
Moving to specific names, Advanced Micro Devices, Inc. is a large-cap semiconductor name showing signs of life technically.
Late last month, the shares knifed atop trendline resistance, rising after the company’s better-than-expected quarterly results and upwardly revised guidance.
The subsequent pullback places the shares 9.3% under the April peak.
Tactically, trendline support closely tracks the 50-day moving average, and is followed by the April range bottom (77.90). The prevailing recovery attempt is intact barring a violation.
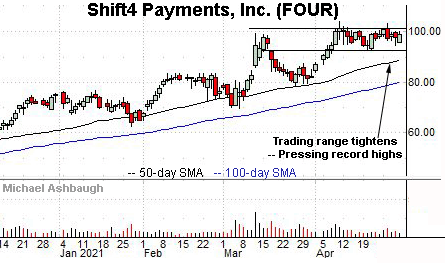
Public since June 2020, Shift4 Payments, Inc. is a large-cap developer of payments processing solutions.
Technically, the shares have asserted an orderly three-week range — a bullish continuation pattern — just under record highs. Tactically, a breakout attempt is in play barring a violation of the range bottom (92.50).
Conversely, a break from the range top (101.40) opens the path to a near-term target in the 110 area.
Note the company’s quarterly results are due out May 6.
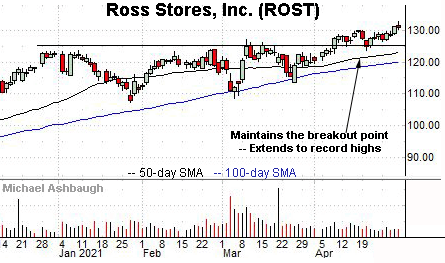
Ross Stores, Inc. is a well positioned large-cap retailer.
As illustrated, the shares have tagged nominal record highs. The prevailing upturn punctuates a tight three-week range — a coiled spring — laying the groundwork for potentially more decisive follow-through.
Tactically, the former range top (129.90) marks a near-term floor, and is followed by the firmer breakout point (125.00). A sustained posture higher signals a firmly-bullish bias.
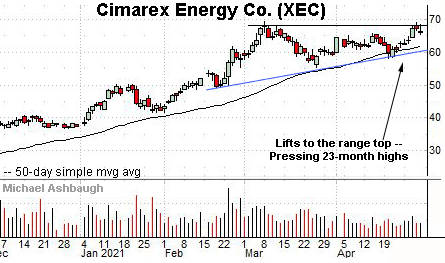
Finally, Cimarex Energy Co. is a well positioned large-cap oil and gas name. (Yield = 1.6%.)
As illustrated, the shares are pressing nearly two-year highs, the best levels since May 2019.
Tactically, trendline support roughly tracks the ascending 50-day moving average, currently 62.10. The 50-day has marked an inflection point, on a closing basis, and a breakout attempt is intact barring a violation.


