Charting a market whipsaw, S&P 500 tags gap resistance after the Fed
Focus: Global market cross currents persist, Japan and Europe confirm downtrends even as China diverges, IEV, EWJ, FXI, XLE
Technically speaking, the major U.S. benchmarks continue to trend broadly lower, pressured amid recently increased volatility.
Against this backdrop, the S&P 500 has tagged gap resistance — at 3,838 — to punctuate the latest in a series of failed technical tests.
Editor’s Note: As always, updates can be directly accessed at https://chartingmarkets.substack.com.
Before detailing the U.S. markets’ wider view, the S&P 500’s hourly chart highlights the past four weeks.
As illustrated, the S&P 500 is digesting a downdraft to 16-month lows.
The initial rally attempt has been flattish, and capped by gap resistance (3,838) detailed previously.
Wednesday’s session high (3,837.5) matched resistance amid the customary Fed-fueled volatility following the latest interest-rate hike.
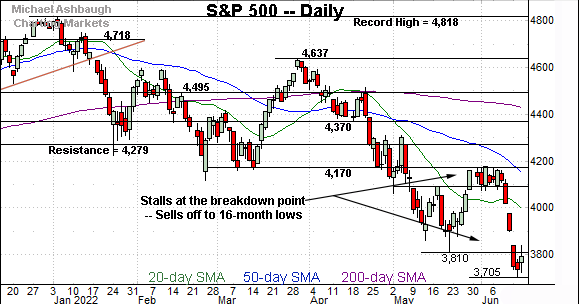
More broadly, the prevailing downturn originates from major resistance (4,170), an area also detailed on the daily chart.
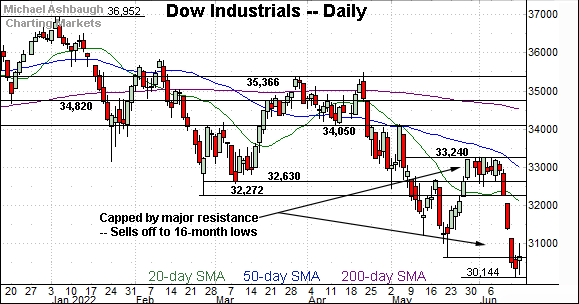
Similarly, the Dow Jones Industrial Average is holding its range bottom.
Here again, the June downdraft originates from major resistance (33,240).
More immediately, a jagged retest of the May low (30,635) remains underway.
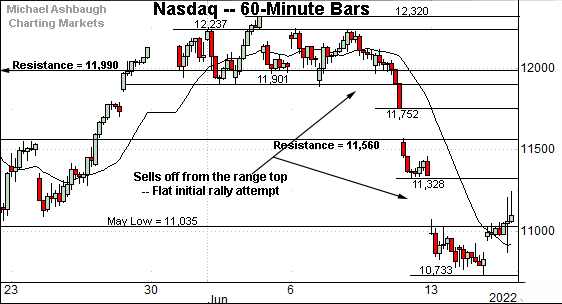
Against this backdrop, the Nasdaq Composite is also digesting a damaging downdraft.
Recall the recent plunge punctuates a tight early-June range. Tactically, the May low (11,035) remains a nearby inflection point.
Widening the view to six months adds perspective.
On this wider view, the Nasdaq has tried to bounce from 20-month lows.
Tactically, the May low (11,035) is closely followed by gap resistance (11,071), detailed previously. An extended retest remains underway.
More broadly, the Nasdaq’s intermediate- to longer-term bias remains firmly-bearish based on today’s backdrop.
Looking elsewhere, the Dow Jones Industrial Average is digesting a plunge to 16-month lows.
Tactically, the May low (30,635) remains a nearby inflection point.
More broadly, the June downdraft originates from major resistance (33,240), detailed repeatedly. (See for instance, the June 2 review.)
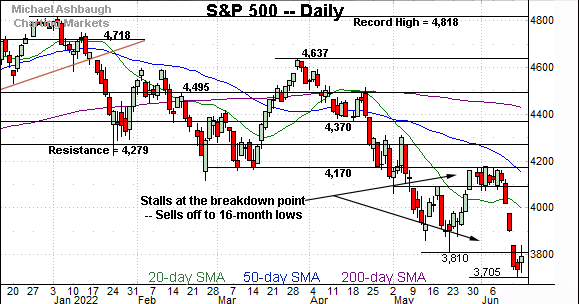
Meanwhile, the S&P 500 has also registered 16-month lows.
Recall the June plunge originates from major resistance (4,170).
More immediately, the 3,810-to-3,838 area marks notable overhead, an area better illustrated on the hourly chart.
The bigger picture
As detailed above, the major U.S. benchmarks continue to trend broadly lower, pressured amid a still firmly-bearish bigger-picture backdrop.
Tactically, the June downdraft originates from major resistance — the S&P 4,170 and Dow 33,240 areas, detailed previously — and confirms each benchmark’s primary downtrend.
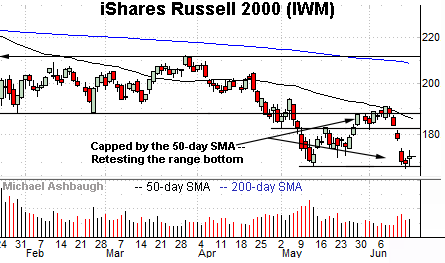
Moving to the small-caps, the iShares Russell 2000 ETF (IWM) has not yet registered new lows.
Still, the recent downturn from the 50-day moving average has been fueled by increased volume, and punctuated by a flattish lighter-volume rally attempt.
The prevailing backdrop lays the groundwork for potential downside follow-through. Tactically, gap resistance (174.96) is followed by firmer overhead in the 181.50-to-181.80 area.
Meanwhile, the SPDR S&P MidCap 400 ETF (MDY) is digesting a plunge 17-month lows.
Against this backdrop, the initial lift from the June low has been flat, and capped by the breakdown point (424.30). Bearish price action.
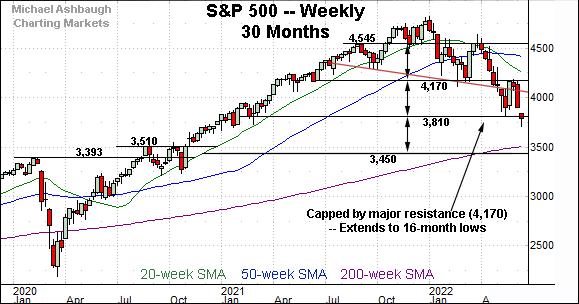
Returning to the S&P 500, this next chart is a weekly view, spanning 30 months. Each bar on the chart represents one week.
As illustrated, the index has reached a lower plateau, venturing under the 3,800 mark.
The prevailing downturn originates from major resistance (4,170).
From current levels, the 3,810-to-3,838 area pivots to notable overhead.
Conversely, the S&P’s next downside target projects to the 3,450 area. Recall the pre-pandemic peak (3,393) rests in the vicinity.
Returning to the six-month view, the S&P 500 has whipsawed this week in the wake of the Federal Reserve’s first 75 basis point rate hike since 1994.
Tactically, the May low (3,810) and gap resistance (3,838) remain overhead inflection points. (See Tuesday’s review.)
Wednesday’s session high (3,837.5) matched resistance amid the post-rate-hike market whipsaw. To reiterate, an eventual close atop this area might be noteworthy.
Beyond technical levels, the June downdraft has been punctuated by brutally bearish market breadth, including the most aggressive single-day downdraft internally in two years.
But against this backdrop, market sentiment — as measured by the the CBOE Volatility Index (VIX) — remains stubbornly complacent for the prevailing market conditions. Ideally, for market bulls, the VIX would be registering a “higher high” as the S&P 500 notches its latest “lower low.”
Combine the recent price action, and the market internals, with the sentiment backdrop, and the S&P 500’s bigger-picture bias remains firmly-bearish pending repairs.
Watch List — Global market cross currents persist
Beyond the U.S., the iShares Europe ETF (IEV) has reached 19-month lows, confirming its primary downtrend.
The prevailing pullback originates from trendline resistance roughly tracking the 50-day moving average.
Tactically, the breakdown point (44.40) pivots to resistance. A rally atop this area would mark a step toward stabilization.
Meanwhile, the iShares MSCI Japan ETF (EWJ) has reached two-year lows, also confirming its primary downtrend.
Here again, the downturn originates from trendline resistance, in this case, very closely tracking the 50-day moving average.
From current levels, the breakdown point (54.55) pivots to resistance. The pending retest from underneath may add color.
Meanwhile, the iShares China Large-Cap ETF (FXI) — profiled June 2 — has diverged from most other global markets, including the U.S.
As illustrated, the shares have sustained a recent trendline breakout — (outpacing Europe and Japan) — asserting a posture atop the 50-day moving average.
Tactically, the prevailing rally attempt is intact barring a violation of the 30.80-to-31.70 area. (Also see the June 9 review.)
Concluding on one stray note, the Energy Select Sector SPDR (XLE) continues to outperform amid otherwise extensive market carnage. (Yield = 2.5%.)
As illustrated, the group has pulled in to its breakout point (81.50) an area closely matching the 50-day moving average, currently 81.74.
The prevailing pullback originates from the June closing peak (92.28) roughly matching the group’s intermediate-term target — the 92.00 area — detailed repeatedly.
Delving slightly deeper, trendline support is followed by an inflection point matching the May low (74.45). A sustained posture higher signals a bullish-leaning intermediate-term bias.


