Charting a market whipsaw, S&P 500 maintains the breakout point
Focus: Crude-oil prices press major support, Rate-sensitive sectors take flight, Intel's precarious posture, USO, XLP, XLU, SMH, INTC
U.S. stocks are mixed early Wednesday, vacillating in the wake of the major benchmarks’ worst daily downturn in about one month.
Against this backdrop, the S&P 500 and Dow Jones Industrial Average have maintained first support amid a downturn that has thus far inflicted limited technical damage.
Editor’s Note: As always, updates can be directly accessed at chartingmarkets.substack.com.
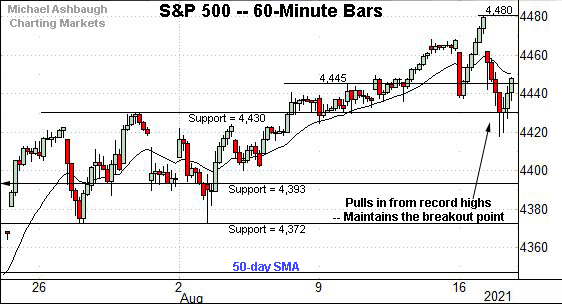
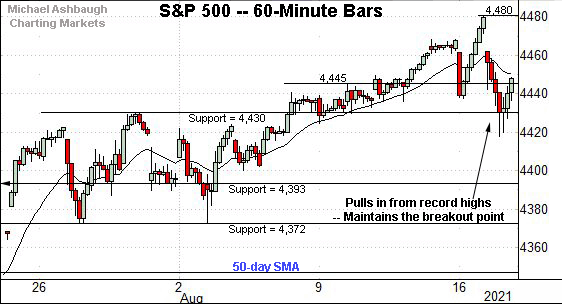
Before detailing the U.S. markets’ wider view, the S&P 500’s hourly chart highlights the past four weeks.
As illustrated, the S&P is digesting its August break to record territory.
Consider that the record peak (4,480) has registered within striking distance of the S&P’s near-term target (4,488) detailed repeatedly. (See for instance, the Aug. 11 review.)
Conversely, initial support, circa 4,445, is followed by the former breakout point (4,430).
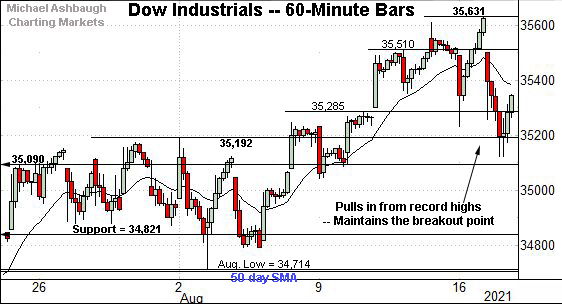
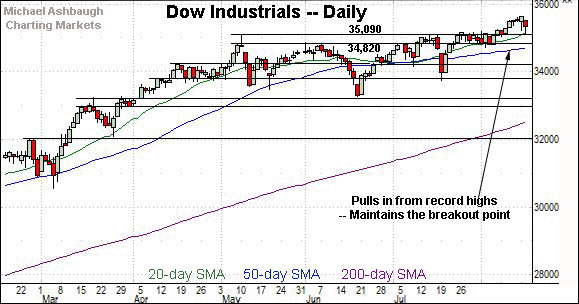
Similarly, the Dow Jones Industrial Average has reversed respectably from its record high, established Monday.
Tactically, the former range top (35,192), detailed previously, has effectively underpinned the prevailing pullback.
Wednesday’s early session low (35,190) has registered nearby.
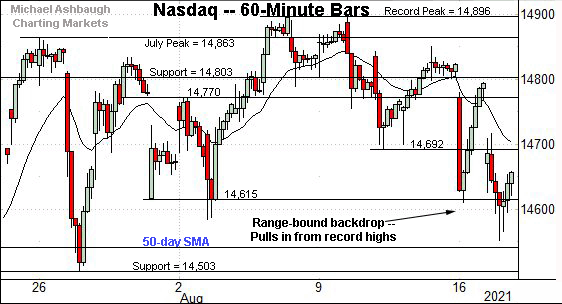
True to recent form, the Nasdaq Composite continues to diverge slightly from the other major benchmarks.
Tactically, the 50-day moving average, currently 14,538, is followed by the one-month range bottom (14,503).
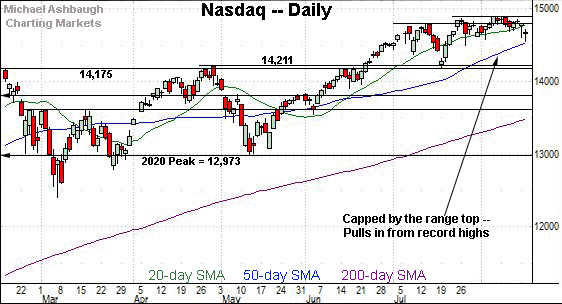
Widening the view to six months adds perspective.
On this wider view, the Nasdaq has extended its pullback from the range top.
From current levels, the 50-day moving average, currently 14,538, is followed by likely last-ditch support broadly spanning from 14,175 to 14,211.
Recall the July low (14,178) closely matched major support.
To reiterate, an eventual violation of this area would mark a material “lower low” — combined with a violation of the 50-day moving average — raising a technical caution flag.
Looking elsewhere, the Dow Jones Industrial Average has sustained its August breakout.
Tactically, the former range top (35,192) — detailed on the hourly chart — and the May peak (35,091) have underpinned the prevailing pullback. Constructive price action.
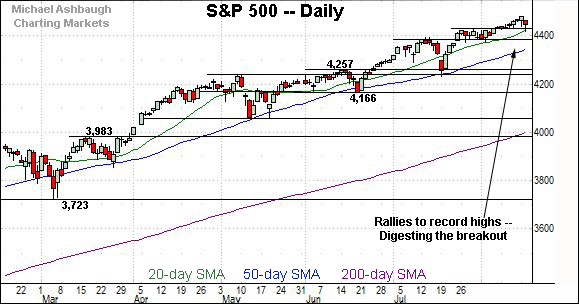
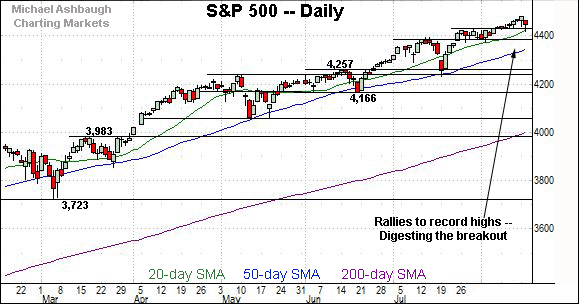
Meanwhile, the S&P 500 is also digesting a recent break to record territory.
Here again, the initial pullback has been underpinned by the breakout point (4,430).
The bigger picture
Collectively, the prevailing backdrop is not one-size-fits-all, though the bigger-picture technicals, on balance, remain constructive.
On a headline basis, the S&P 500 and Dow industrials have sustained August breakouts, while the Nasdaq Composite continues to diverge, pulling within view of its 50-day moving average.
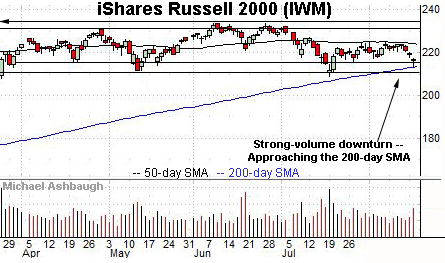
Moving to the small-caps, the iShares Russell 2000 ETF remains range-bound.
Still, the prevailing strong-volume downturn places the marquee 200-day moving average, currently 213.50, firmly within view. The small-cap benchmark has not closed under its 200-day moving average since September 2020.
Delving deeper, the July lows — at 209.05 and 211.73 — mark important inflection points. An eventual violation would signal a primary trend shift, raising a technical red flag.
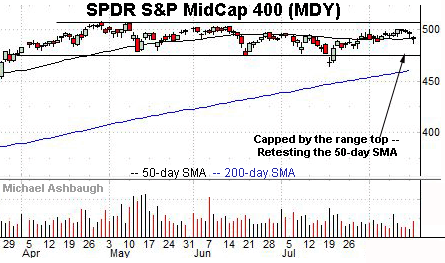
Meanwhile, the SPDR S&P MidCap 400 ETF remains comparably stronger than the small-caps.
Tactically, the latest retest of the 50-day moving average, currently 490.40, remains underway.
Placing a finer point on the S&P 500, the index has whipsawed this week near record highs.
Tactically, the breakout point (4,430) remains the first notable floor.
Delving deeper, recall the August low (4,373) closely matches the former range bottom (4,372).
More broadly, the S&P’s prevailing pullback does not yet scream “raging bear.”
Tactically, recall the ascending 50-day moving average, currently 4,346, has effectively defined the prevailing bull trend. The S&P has not registered consecutive closes under the 50-day moving average since late October.
Delving deeper, familiar last ditch-support matches the June breakout point (4,257) and the July closing low (4,258).
As always, it’s not just what a benchmark does, it’s how it does it.
But broadly speaking, the S&P 500’s intermediate-term bias remains bullish barring a violation of the 4,257 area.
Editor’s note: The next review will be published Friday.
Watch List
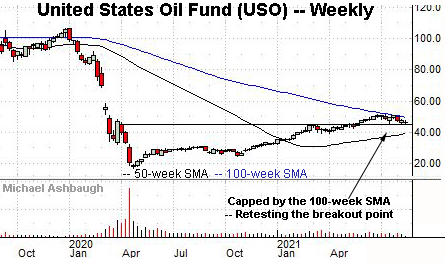
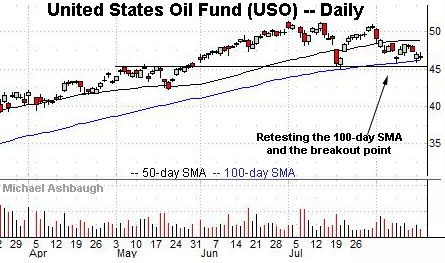
Drilling down further, the United States Oil Fund has asserted a range, consolidating between two notable levels. The fund tracks the spot price of light, sweet crude oil.
To the downside, the USO has maintained major support matching its breakout point (45.40) and the 100-day moving average, currently 46.25.
Conversely, the USO’s rally attempt has stalled near the 100-week moving average, currently 49.64.
These areas punctuate a relatively tight summer range, illustrated on the weekly chart.
Tactically, the prevailing coiled spring, of sorts, lays the groundwork for a potentially decisive break in either direction. A violation of support would mark a return to pandemic-zone territory. Conversely, a break from the range top opens the path to a less-charted patch, punctuated by the massive 2020 gap.
Rate-sensitive sectors take flight
Moving to U.S. sectors, the rate-sensitive groups have broken out. The consumer staples and utilities exemplify the prevailing backdrop:
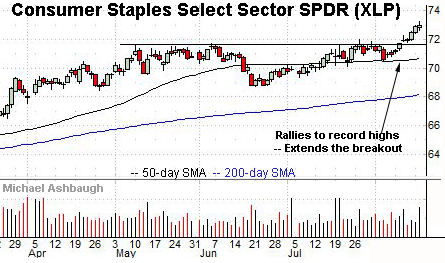
To start, the Consumer Staples Select Sector SPDR has knifed to record highs. (Yield = 2.5%.)
Recent strength has been fueled by increased volume to punctuate an inverse head-and-shoulders pattern defined by the May, June and August lows.
Tactically, the breakout point, circa 71.70, pivots to notable support.
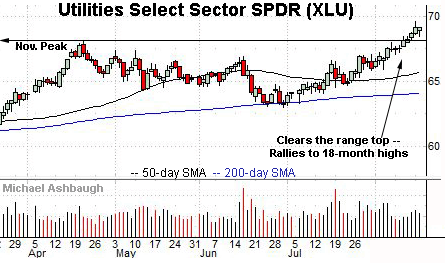
Meanwhile, the Utilities Select Sector SPDR has rallied to 18-month highs. (Yield = 3.1%.)
Tactically, a notable floor spans from 67.93 to 68.05, levels matching the November and April peaks.
Delving much deeper, the prevailing upturn punctuates a successful test of the 200-day moving average at the June and July lows.
More broadly, the rate-sensitive groups have surged at least partly amid a safe-haven trade, fueled by heightened virus concerns and recent geopolitical tensions.
Separately, these groups may have strengthened amid a developing view that Treasury yields will remain relatively lower for longer than previously expected. The 10-year Treasury yield has recently stalled at its 50-day moving average, a bull-bear inflection point going back pre-pandemic. (Also notice the yield’s pending death cross, or bearish 50-day/200-day moving average crossover.)
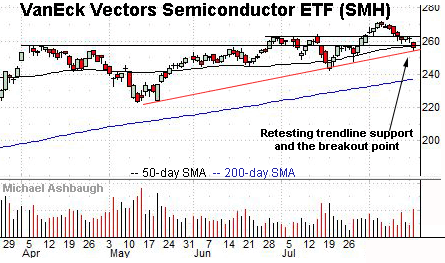
Looking elsewhere, the VanEck Vectors Semiconductor ETF has reached a notable technical test.
Specifically, the group is retesting trendline support, an area closely matching the 50-day moving average, currently 257.22, and the former breakout point (257.15).
Against this backdrop, the group’s intermediate-term bias remains guardedly bullish. Still, the prevailing stronger-volume downturn is worth tracking for potential follow-through.
Tactically, a closing violation of the trendline would raise a caution flag. Likely last-ditch support points — around 247.40 and 242.10 — match the July lows.
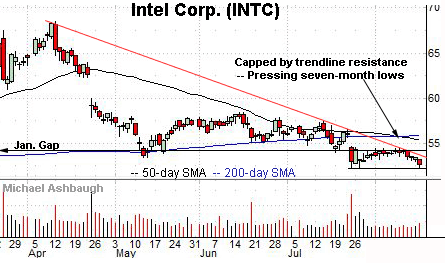
Finally, Dow 30 component Intel Corp. is a former semiconductor sector bellwether.
As illustrated, the shares have asserted a firmly-bearish posture, digesting the July breakdown.
Tactically, the prevailing range bottom (52.22) closely matches Intel’s 200-week moving average, currently 52.46. An eventual violation opens the path to a less-charted patch and potentially swift downside follow-through.
Conversely, trendline resistance is followed by the prevailing range top (54.40). A rally atop this area would place the brakes on bearish momentum.


