Market cross currents persist, S&P 500 pulls in to first support
Focus: Crude oil asserts bearish backdrop, Microsoft's stealth breakout attempt, Meta Platforms (formerly Facebook) reaches key technical test, USO, MSFT, FB, KBH, YELL
U.S. stocks are firmly lower early Monday, pressured amid renewed virus worries ahead of the Federal Reserve’s policy directive due out Wednesday.
Against this backdrop, the S&P 500 has pulled in toward near-term support, as the Nasdaq Composite and Dow industrials approach more important technical floors — the Nasdaq 15,400 and Dow 35,630 areas.
Editor’s Note: As always, updates can be directly accessed at chartingmarkets.substack.com.
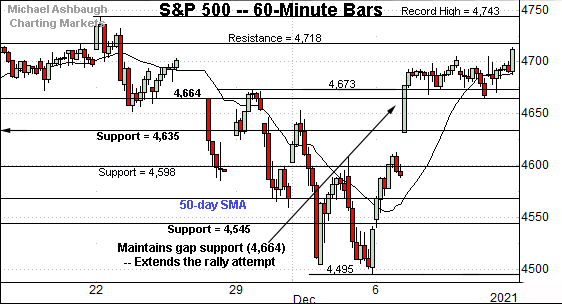
Before detailing the U.S. markets’ wider view, the S&P 500’s hourly chart highlights the past four weeks.
As illustrated, the S&P extended its rally attempt to conclude last week.
With Monday’s early downturn, familiar support matches the November gap (4,664).
Delving deeper, the S&P’s former breakdown point (4,635) closely matches the December gap (4,632).
Similarly, the Dow Jones Industrial Average concluded last week with a nominal new high.
But here again, the index is firmly on the defensive early Monday.
Tactically, major support (35,630) — an area better illustrated on the daily chart — is currently under siege.
Monday’s early session low (35,622) registered nearby.
Against this backdrop, the Nasdaq Composite has staged a comparably lackluster rally attempt.
Recall the index remains capped by the early-December peak (15,816), unlike the other benchmarks.
Tactically, gap support (15,507) is closely followed by the early-November low (15,470).
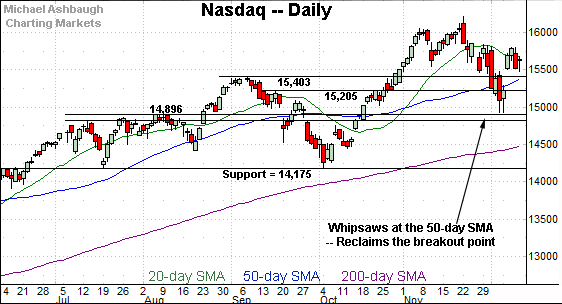
Widening the view to six months adds perspective.
On this wider view, the Nasdaq is digesting a bullish reversal atop the breakout point (15,403), a familiar bull-bear fulcrum.
Delving slightly deeper, the 50-day moving average, currently 15,382, is rising toward major support.
Tactically, a sustained posture atop this area — the 15,380-to-15,400 area — signals a bullish intermediate-term bias.
Looking elsewhere, the Dow Jones Industrial Average has extended its bullish reversal from the 34,000 mark.
Still, this week’s soft start has placed its breakout point (35,630) back in play.
To reiterate, Monday’s early session low (35,622) registered nearby. A retest remains underway.
Delving deeper, the 50-day moving average, currently 35,440, is followed by the former range top (35,090). Broadly speaking, a sustained posture atop this area signals a bullish intermediate-term bias.
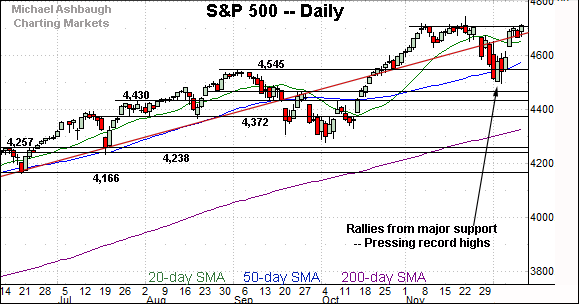
Meanwhile, the S&P 500 remains the strongest major benchmark.
In fact, last week’s close (4,712.02) marked a nominal record close, eclipsing the previous record (4,704.54) established Nov. 18.
Despite the modest upturn, an extended breakout attempt remains underway. (Also see the hourly chart.)
The bigger picture
The major U.S. benchmarks are back on the defensive early Monday, pressured ahead of the Federal Reserve’s policy directive, due out Wednesday afternoon.
Against this backdrop, the bigger-picture technicals remain bullish, on balance, though cross currents are in play. (See, for instance, the Russell 2000’s backdrop.) The prevailing pullback is worth tracking for potential acceleration.
As it applies to technical levels, the Dow Jones Industrial Average has challenged major support (35,630) early Monday. The prevailing retest — across potentially the next several sessions — may add color.
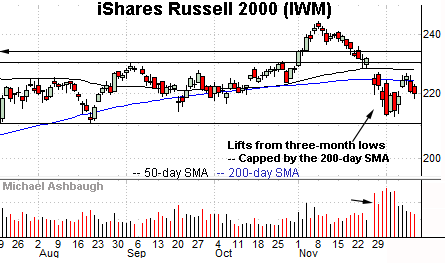
Moving to the small-caps, the iShares Russell 2000 ETF has registered shaky, if not outright bearish, December price action.
Its early-month downdraft has been punctuated by a lackluster rally attempt — or corrective bounce — fueled by decreased volume.
Tactically, eventual follow-through atop the 200-day moving average, currently 224.34, and the former range top (229.84) would place the small-cap benchmark on firmer ground.
Meanwhile, the SPDR S&P MidCap 400 ETF remains comparably stronger than the Russell 2000.
Nonetheless, an extended retest of its former breakout point (506.00) remains underway.
Delving deeper, the prevailing upturn originates from a shaky test of the 200-day moving average, currently 494.18.
Placing a finer point on the S&P 500, the index continues to outperform other widely-tracked benchmarks.
Tactically, gap support (4,664) is defined by the Nov. 26 session high, the day the omicron variant surfaced.
This area has thus far underpinned the S&P 500’s bullish reversal from the December low. Constructive price action.
On further weakness, the 4,632-to-4,635 area matches the S&P’s former breakdown point and the December gap.
More broadly, the S&P 500 rattled its range top last week.
Tactically, gap support (4,632) is followed by the ascending 50-day moving average, currently 4,580.
Delving deeper, the S&P’s breakout point (4,545) remains a more important bull-bear fulcrum.
As always, it’s not just what the markets do, it’s how they do it.
But generally speaking, the S&P 500’s intermediate-term bias remains bullish barring a sustained violation of the 4,545 area. The response to the Federal Reserve’s policy statement, due out Wednesday, will likely add color.
Watch List
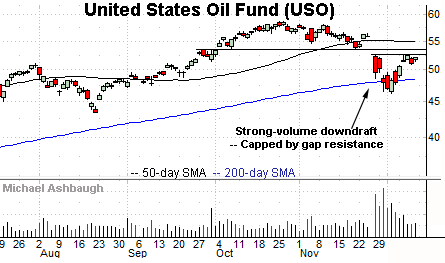
Drilling down futher, the United States Oil Fund has asserted a bearish intermediate-term backdrop. The fund tracks the spot price of light, sweet crude oil.
Late last month, the shares gapped firmly lower, pressured amid a volume spike amid concerns that omicron’s emergence may stem global growth.
The subequent rally attempt has been comparably flat, and capped by resistance closely matching the bottom of the gap (52.40).
Tactically, slightly more distant overhead matches the breakdown point (53.50). Eventual follow-through atop this area would neutralize the virus-fueled downdraft.
Fundamentally, market bulls may contend easing energy prices present a positive development against the prevailing inflationary economic backdrop.
Moving to specific names, Microsoft Corp. is a well positioned Dow 30 component.
As illustrated, the shares have asserted an orderly six-week range, hinged to the strong-volume October earnings-fueled breakout.
More immediately, the prevailing upturn originates from the 50-day moving average, and has been punctuated by Microsoft’s second-best close on record.
Tactically, the 343.10-to-344.60 area marks notable overhead. A near-term target projects to the 366 area on follow-through.
Looking elsewhere, Meta Platforms, Inc. — the company formerly known as Facebook — has reached a key technical test.
Specifically, the shares are pressing the 50-day moving average (330.50) and 200-day moving average (331.00), widely-tracked intermediate- to longer-term trending indicators.
The prevailing upturn has registered amid a death cross — or bearish 50-day/200-day moving average crossover — a signal that registered Thursday.
Tactically, trendline resistance, circa 340, is followed by the prevailing range top (353.80). Eventual follow-through atop these areas would place the shares on firmer technical footing.
KB Home is a well positioned mid-cap homebuilder.
Technically, the shares have tagged six-month highs, rising from a head-and-shoulders bottom defined by the August, October and November lows.
Moreover, the slight breakout has been punctuated by a bull flag — the tight one-week range — hinged to the steep December rally.
Tactically, near-term support (43.76) is followed by the 200-day moving average, currently 43.24. The prevailing rally attempt is intact barring a violation.
Finally, Yellow Corp. is a well positioned small-cap trucking name.
As illustrated, the shares have asserted an orderly one-month range — a bullish continuation pattern — hinged to the steep October rally.
Against this backdrop, last week’s strong-volume upturn has been punctuated by persistence near the range top, improving the chances of an eventual breakout. (Selling pressure has been muted near well-defined resistance.)
Tactically, a near-term target projects to the 17.00 area on follow-through.


