


Charting a bullish reversal, S&P 500 vies to rally from major support (4,818)
Focus: Major U.S. benchmarks bounce amid bearish longer-term backdrop

Technically speaking, the major U.S. benchmarks are vying to rally in the wake of a damaging volatility spike.
Against this backdrop, the S&P 500 has maintained major support — matching the 2022 peak (4,818) — and the quality of the rally attempt should be a useful bull-bear gauge. The charts below add color:
Editor’s Note: As always, updates can be directly accessed at chartingmarkets.substack.com.
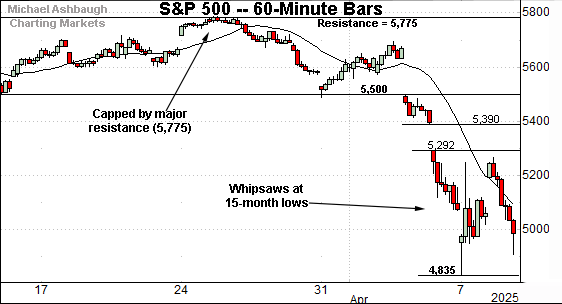
Before detailing the U.S. markets’ wider view, the S&P 500’s hourly chart highlights the past four weeks.
As illustrated, the S&P 500 has plunged to 15-month lows.
The prevailing downturn punctuates a failed test of the breakdown point (5,775) an area better illustrated on the daily chart.
Tactically, near-term technical levels are not so well-defined. Gap resistance (5,292) stands out as an overhead inflection point.
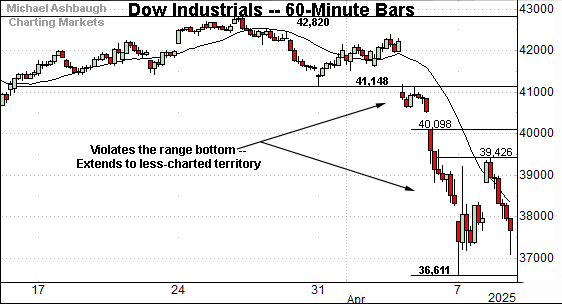
Meanwhile, the Dow Jones Industrial Average has also turned firmly lower.
Consider that selling pressure accelerated as the index ventured under the 40,000 mark.
And here again, the wide-ranging price action has contributed to not so well-defined technical levels. At least as it applies to near-term inflection points.
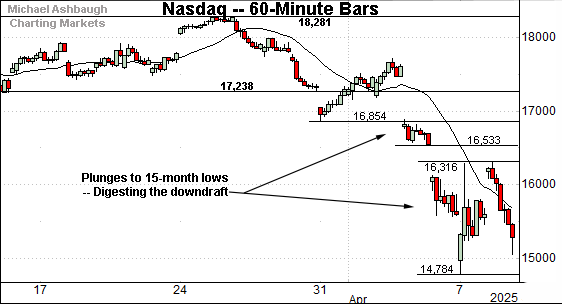
Against this backdrop, the Nasdaq Composite has also staged an aggressive April downdraft.
In the process, the index is traversing less-charted territory near 15-month lows. Tactically, the 16,300 area marks an inflection point also illustrated below.
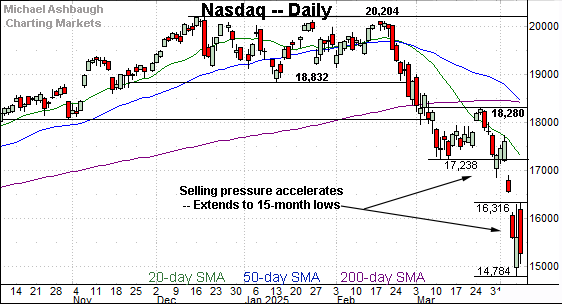
Widening the view to six months adds perspective.
On this wider view, the Nasdaq has extended a downdraft from the February peak. Recent downside follow-through punctuates a sluggish March rally attempt.
Separately, notice the death cross — or bearish 50-day/200-day moving average crossover — an event that has signaled as this is written. Though frequently a lagging indicator, the crossover signals that the intermediate-term downtrend has overtaken the longer-term trend. (In this case, the 200-day average’s slope has ticked lower, also consistent with a longer-term downtrend.)
Tactically, the post-breakdown peak (18,280) is closely followed by the 200-day moving average, currently 18,406. The Nasdaq’s longer-term bias points lower pending a rally atop these areas.
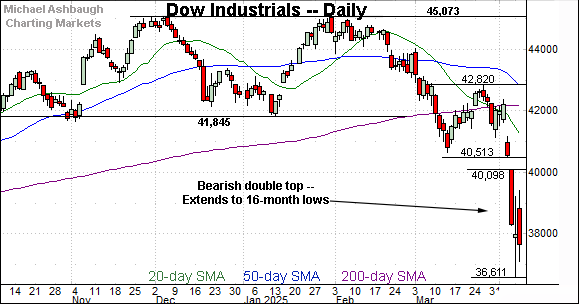
Looking elsewhere, the Dow Jones Industrial Average has also plunged to less-charted territory.
The downdraft punctuates a sizeable double top — the M formation — defined by the December and January peaks.
Tactically, gap resistance — around 40,100 and 40,500 — is followed by the firmer breakdown point (41,845).
An eventual rally atop the breakdown point (41,845) would mark a step toward stabilization. The pending retest from underneath — if the Dow can snap back — should be a useful bull-bear gauge.
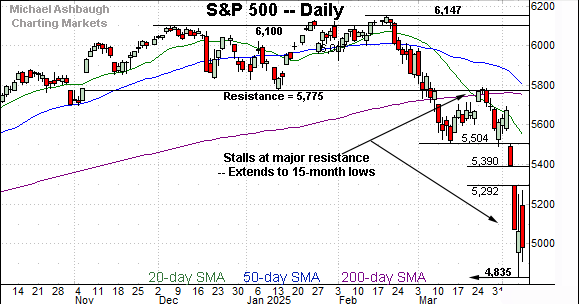
Meanwhile, the S&P 500 has plunged to 15-month lows.
The prevailing downturn punctuates a failed test of the breakdown point (5,775) an important level detailed previously. The late-March closing high (5,776) effectively matched resistance.
On a positive note, the S&P has maintained major support (4,835) an area detailed in the next section.
The bigger picture
As detailed above, the major U.S. benchmarks have registered a damaging market downdraft. From top to bottom:
The Dow industrials have pulled in as much as 8,462 points, or 18.8%, from the record high established late last year.
The Nasdaq Composite has plunged as much as 5,420 points, or 26.8%, from its corresponding record high.
The S&P 500 has dropped 1,312 points, or 21.3%, from its record high established just seven weeks ago.
(It’s worth noting the numbers above include intraday lows, resulting in bigger losses. On a closing basis, the S&P 500 has dropped as much as 17.6% from its record high, the Nasdaq has plunged 22.7% and the Dow industrials have lost 15.7%. Still big numbers, either way.)
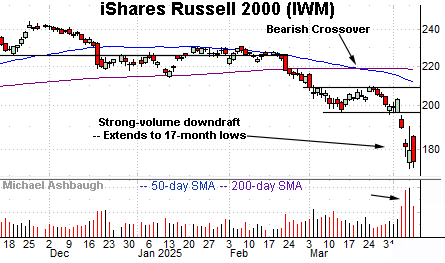
Moving to the small-caps, the iShares Russell 2000 ETF (IWM) has broken down technically.
The downdraft to 17-month lows has been fueled by a volume spike, and punctuates a relatively tight one-month range. (The March range.)
Tactically, the breakdown point (197) pivots to resistance. A rally atop this area would mark an early step toward stabilization.
(On a granular note, recall the death cross — or bearish 50-day/200-day moving average crossover — an event preceding recent downside follow-through.)
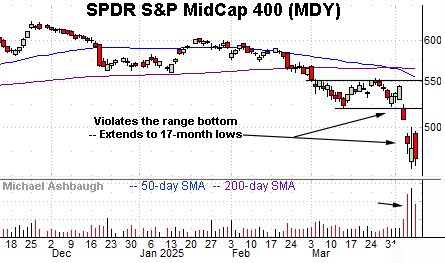
Similarly, the SPDR S&P MidCap 400 ETF (MDY) has plunged to 17-month lows, its worst levels since November 2023.
Here again, the downdraft has been fueled by a volume spike. Tactically, gap resistance (508) is followed by the firmer breakdown point (520). A reversal atop these areas would mark technical progress.
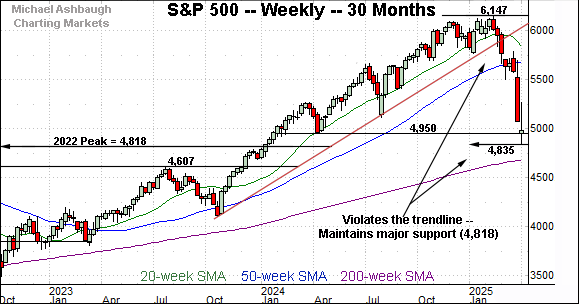
Returning to the S&P 500, this next chart is a weekly view spanning 30 months. Each bar on the chart represents one week.
As illustrated, the S&P has turned firmly lower, placing distance under trendline support.
But amid the downturn, the S&P has at least initially maintained a key technical level. Consider that the April low (4,835) — established this week — has registered slightly above major support matching the 2022 peak (4,818).
The quality of the rally from this area — and a rally seems to be underway as this is written — should be a useful bull-bear gauge.

Narrowing to the S&P 500’s six-month view lends more immediate perspective.
On a headline basis, the S&P has plunged to 15-month lows. But as always, it’s not just what the markets do, it’s how they do it.
By this measure, the market downdraft has — perhaps not surprisingly — encompassed firmly bearish price action.
For instance, the index concluded last week with consecutive sessions during which market breadth registered bearish extremes. A 7-to-1 down day Thursday followed by an 11-to-1 down day Friday. (NYSE down volume surpassed up volume by the stated margin.)
And as always, in a textbook world, two 9-to-1 down days — across about a seven-session window — reliably signals a major trend shift.
So the prevailing downturn has not quite satisfied the textbook threshold, but it has come close, and the selling pressure has registered amid otherwise technically consequential price action.
Against this backdrop, the S&P 500 is near-term oversold, and due at least a corrective bounce. The quality of the rally from major support (4,818) — as measured by volume, breadth and price action — is worth tracking. (Gap resistance (5,292) marks a nearby technical test.)
But more importantly, the April downdraft has inflicted extensive damage, and the S&P 500’s longer-term bias remains bearish pending repairs. (Also see the March 20 review.)
Tactically, two familiar levels remain in play:
The 200-day moving average, currently 5,755.
The breakdown point (5,775), a level formerly defining the post-election low.
Combined, the cross section of these areas — the 5,755-to-5,775 area — remains a longer-term bull-bear fulcrum. (Also see the March 7 review.)
An eventual rally atop this area would signal waning bearish momentum, and a bullish-leaning longer-term bias.
But based on today’s backdrop, the sustained posture under resistance — the 5,775 inflection point — continues to signal a bearish longer-term bias. Beyond specific levels, establishing a durable market uptrend will more likely be a process, not an event.
Also see March 20: Charting a bearish technical tilt, S&P 500 digests damaging market downdraft.