Charting a corrective bounce, S&P 500 rallies after violating 20-day volatility bands
Focus: 10-year Treasury note yield continues to challenge one-decade range top
Technically speaking, the major U.S. benchmarks are vying to rally, rising respectably from multi-month lows.
Still, the prevailing upturn punctuates a statistically extreme June downdraft, a move confirming each benchmark’s primary downtrend. The quality of the prevailing rally attempt — likely a corrective bounce — will nonetheless add color.
Editor’s Note: As always, updates can be directly accessed at https://chartingmarkets.substack.com.
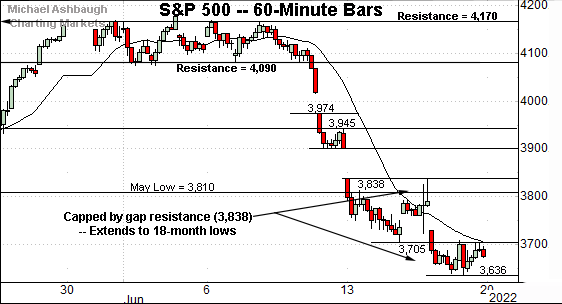
Before detailing the U.S. markets’ wider view, the S&P 500’s hourly chart highlights the past four weeks.
As illustrated, the S&P 500 is digesting an aggressive June downdraft.
Tactically, gap resistance (3,838) remains an inflection point.
Recall Wednesday’s session high (3,837.5) matched resistance almost immediately after the Federal Reserve’s policy statement.
More broadly, the prevailing downturn originates from major resistance (4,170), an area also detailed on the daily chart.
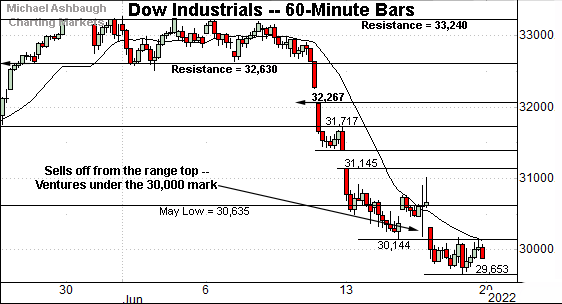
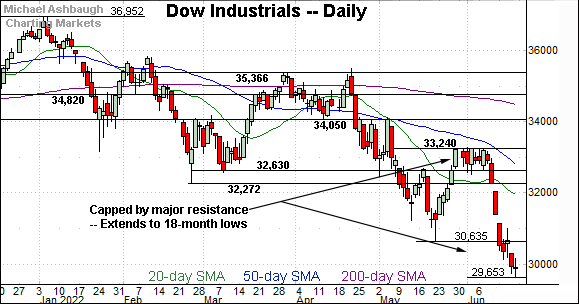
Similarly, the Dow Jones Industrial Average has plunged from its range top.
Tactically, the May low (30,635) marks an overhead inflection point, also detailed on the daily chart.
More broadly, the prevailing downturn originates from major resistance (33,240).
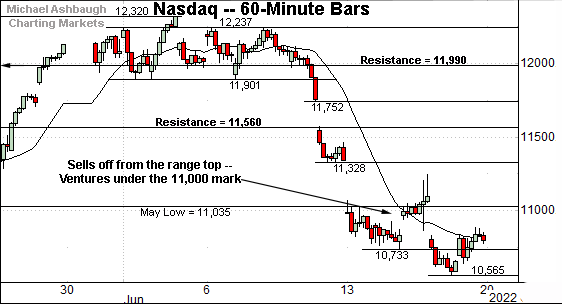
Against this backdrop, the Nasdaq Composite is also digesting a damaging downdraft.
Tactically, the May low (11,035) is followed by the post-breakdown peak (11,244) and more distant gap resistance (11,328).
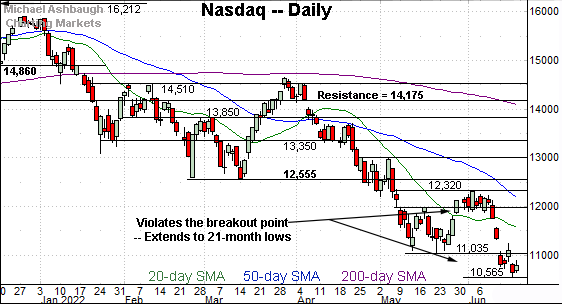
Widening the view to six months adds perspective.
On this wider view, the Nasdaq has tagged 21-month lows.
The mid-June downdraft has been directionally sharp, and punctuated by a comparably flattish rally attempt. Bearish price action.
Though near-term extended — and a corrective bounce seems to be underway — the Nasdaq’s longer-term path of least resistance continues to point lower.
Looking elsewhere, the Dow Jones Industrial Average has registered 18-month lows.
To reiterate, the May low (30,635) remains an overhead inflection point.
More broadly, the June downdraft originates from major resistance (33,240), detailed repeatedly.
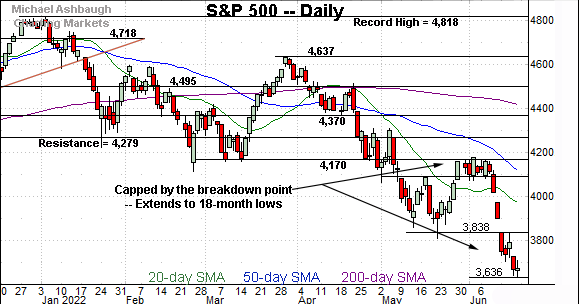
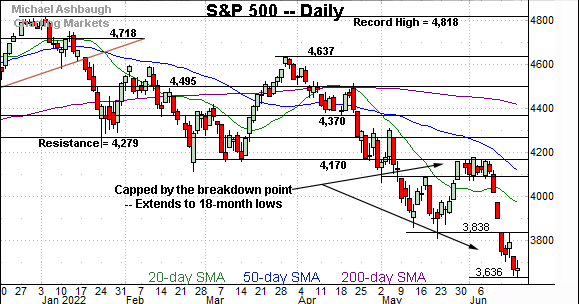
Meanwhile, the S&P 500 has also registered 18-month lows, its lowest level since December 2020.
Recall the June plunge originates from major resistance (4,170).
More immediately, the 3,810-to-3,838 area marks notable overhead, an area also illustrated on the hourly chart.
The bigger picture
As detailed above, the U.S. benchmarks’ bigger-picture backdrop remains bearish.
Each big three benchmark has notched at least 18-month lows, confirming its primary downtrend amid an aggressive June downdraft.
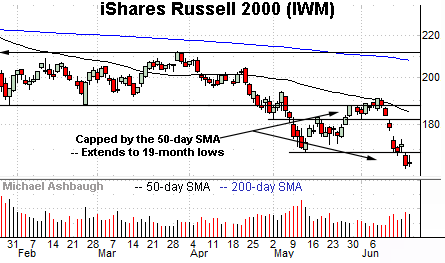
Moving to the small-caps, the iShares Russell 2000 ETF (IWM) has extended its downturn, tagging 19-month lows.
The prevailing downturn has been fueled by increased volume, and punctuates a failed test of the 50-day moving average.
Tactically, the breakdown point (169.80) pivots to first resistance.
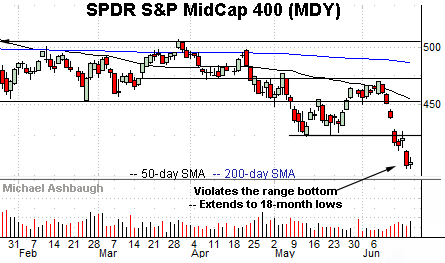
Meanwhile, the SPDR S&P MidCap 400 ETF (MDY) has registered 18-month lows. Here again, recent weakness has been fueled by increased volume.
Tactically, gap resistance (413.70) is followed by the firmer breakdown point (424.30). A reversal atop these areas would mark technical progress.
Returning to the S&P 500, the index has confirmed its primary downtrend.
Put differently, the index has knifed firmly under the May low (3,810) pressured amid an aggressive 4.5% technical breakdown. (The June low has registered 4.5% under the May low.)
Moreover, the downdraft has marked a two standard deviation technical breakdown, punctuated by three closes under the 20-day volatilty bands across a four-session window.
As always, consecutive closes under the volatilty bands (also known as Bollinger bands) signal a tension between time horizons.
To start, the S&P 500 is near-term extended, and due to bounce, following an aggressive downdraft placing it outside the “normal” range of its trailing 20-day volatility. A reversion to the mean (or a bounce) is to be expected.
But more importantly, the June downdraft has been fueled by statistically extreme selling pressure, leaving the index vulnerable to longer-term incremental downside. (See the early-May downdraft, comparably flat rally attempt, and subsequent downside follow-through. Also see the aggressive January downdraft, and downside follow-through. The volatility bands are illustrated via this link.)
Tactically, the 3,810-to-3,838 area marks notable overhead, also detailed on the hourly chart. A close atop this area would mark technical progress.
Beyond near-term issues, the S&P 500’s bigger-picture bias remains firmly-bearish pending more extensive repairs.
Watch List — 10-Year yield challenges one-decade range top
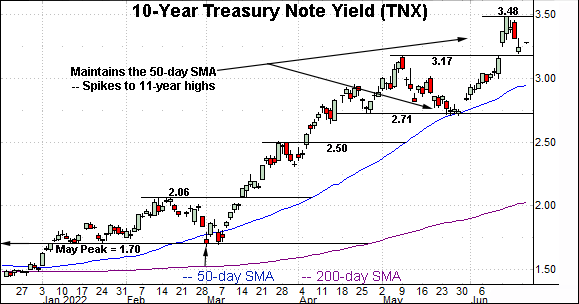
Concluding on a stray note, the 10-year Treasury note yield (TNX) has asserted a higher plateau, sustaining the June breakout across six straight sessions.
In the process, the yield briefly tagged 11-year highs, its highest level since April 2011.
More broadly, the 2018 peak (3.25) remains a headline inflection point, detailed on the monthly chart.
Last week’s close (3.24) matched the range top amid a retest that remains underway.
As detailed last week, upside follow-through opens the path to a potentially significant incremental leg higher, possibly rivaling the nearly 150 basis point March-through-May spike. The next several sessions, and the monthly close, may add color.
(On a granular note, the yield’s June spike marked a two standard deviation breakout, punctuated by consecutive closes atop the 20-day Bollinger bands. The aggressive upturn improves the chances of upside follow-through following a cooling-off period.)


