Charting a corrective bounce: S&P 500 tries to rally amid technical damage
Focus: Market downdraft inflicts sub-sector damage, TRAN, XLF, QQQ, XLI, XLB
U.S. stocks are higher early Wednesday, rising ahead of the Federal Reserve’s latest policy statement, and amid signs of a solution to a corporate debt debacle in China.
Against this backdrop, the major U.S. benchmarks have rallied respectably from the September low, though in the wake of a technically damaging market downdraft.
Based on today’s backdrop, the S&P 500 has signaled a bearish intermediate-term bias pending repairs.
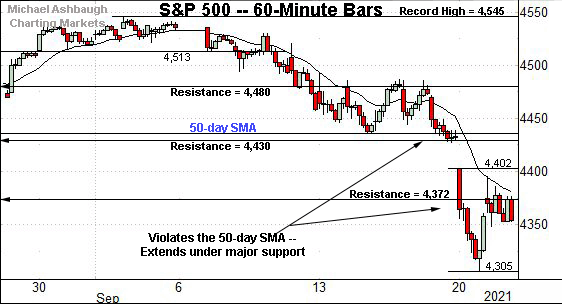
Before detailing the U.S. markets’ wider view, the S&P 500’s hourly chart highlights the past four weeks.
As illustrated, the S&P has extended firmly under its 50-day moving average, briefly tagging two-month lows.
Tactically, notable overhead spans from 4,367 to 4,372, a headline bull-bear inflection point, detailed repeatedly. Wednesday’s early session low (4,367) has matched the inflection point.
More distant overhead matches the bottom of the gap (4,402).
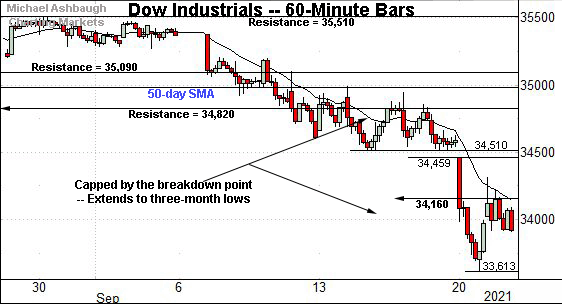
Meanwhile, the Dow Jones Industrial Average has tagged three-month lows.
This week’s downdraft punctuates a failed test of the breakdown point (34,820) from underneath.
From current levels, the Dow’s former range bottom (34,160) is followed by more distant gap resistance (34,459).
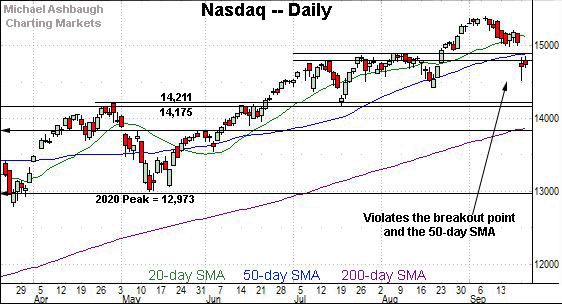
Against this backdrop, the Nasdaq Composite has also broken down — at least for the near-term.
The prevailing downdraft places the Nasdaq under its breakout point (14,896) and the 50-day moving average, currently 14,879.
Widening the view to six months adds perspective.
On this wider view, the Nasdaq has gapped under two key levels.
The specific area matches the 50-day moving average, currently 14,879, and the breakout point (14,896).
This area pivots to define the breakdown point (14,896). A retest from underneath is already underway early Wednesday.
Tactically, a swift reversal atop the breakdown point would neutralize the downdraft, preserving a bullish intermediate-term bias. The next several sessions will likely add color.
Looking elsewhere, the Dow industrials has extended its downdraft, confirming an early-month trend shift.
Recall the Dow initially asserted a bearish intermediate-term bias on Sept. 10.
The prevailing downturn punctuates a bear flag, of sorts, capped by the breakdown point (34,820). (Also see the hourly chart.)
Delving deeper, the 200-day moving average, currently 33,226, is rising toward the June low (33,271).
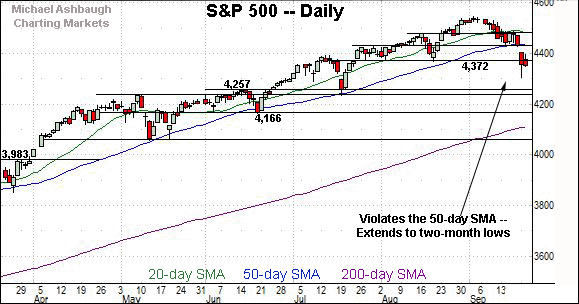
Meanwhile, the S&P 500’s September downturn has accelerated this week.
In the process, the index has registered consecutive closes slightly under the 4,372 support, a key bull-bear inflection point detailed repeatedly.
Slightly more broadly, the downturn punctuates a decisive violation of the 50-day moving average.
The bigger picture
Collectively, the September market downdraft has accelerated, inflicting potentially consequential technical damage in spots.
Against this backdrop, the major U.S. benchmarks are firmly higher early Wednesday, rising ahead of the Federal Reserve’s policy statement.
The quality of the prevailing rally attempt — as partly measured by each benchmark’s response to resistance — will likely add color.
Moving to the small-caps, the iShares Russell 2000 ETF has edged under its marquee 200-day moving average, currently 219.18.
Still, the small-cap benchmark has maintained a posture comfortably atop the August low, exhibiting relative strength versus the S&P 500. A range-bound backdrop is intact for now.
Meanwhile, the SPDR S&P MidCap 400 ETF has tested major support.
Recall the prevailing range bottom, circa 475.10, roughly matches the 200-day moving average, currently 474.30. Here again, the prevailing range is technically intact based on today’s backdrop.
Looking elsewhere, the SPDR Trust S&P 500 ETF has violated trendline support tracking the 50-day moving average.
Moreover, the aggressive initial downdraft was fueled by aggressive momentum, pressing bearish extremes: NYSE declining volume surpassed advancing volume by a greater than 8-to-1 margin.
And as always, in a textbook world, two 9-to-1 down days — across about a seven-session window — would reliably signal a major trend shift.
Put differently, the prevailing downturn leaves the S&P 500 vulnerable to potentially consequential downside follow-through across about the next week.
On the positive side, consider that previous volume spikes have punctuated bullish reversals marking intermediate-term lows. (See the arrows.)
The difference today is that the S&P has violated its 50-day moving average — amid the strongest volume spike — whereas prior downturns had been underpinned by the 50-day.
Placing a finer point on the S&P 500, the index has plunged to two-month lows.
Recall the prevailing downdraft originates from a failed test of the breakdown point (4,480) from underneath.
More broadly, the S&P 500 has registered consecutive closes under its 50-day moving average for the first time since early November. (The 50-day tracks trendline support, detailed on the SPY’s chart.)
Delving deeper, the S&P has also ventured under last-ditch support matching the former range bottom (4,372) and the August low (4,367).
Wednesday’s early session low (4,367) has matched the inflection point amid the S&P’s first real rally attempt.
So collectively, the S&P 500 has violated key trendline support amid aggressive 8-to-1 negative breadth. The downturn technically signals a bearish intermediate-term trend shift pending repairs.
Tactically, trendline resistance closely tracks the 50-day moving average, currently 4,436, and roughly matches the top of the gap (4,427). A swift reversal atop this area would neutralize the September downdraft, placing the S&P 500 back on the bullish track.
The next several sessions, and the response to the Fed’s policy statement, will likely add color.
Watch List — Traditional sector leaders violate key levels
Drilling down further, the September market downdraft has inflicted U.S. sub-sector damage. Quickly consider the traditional sector leaders — the transports, financials and technology sector.
To start, the Dow Transports — profiled last week — have indeed violated major support.
The specific area matches a five-month range bottom (14,243) and the 200-day moving average, currently 14,236.
As always, the 200-day moving average is a widely-tracked longer-term trending indicator.
Tactically, a swift reversal atop the 14,240 area would place the brakes on bearish momentum.
Note that sector bellwether FedEx Corp. is firmly lower early Wednesday — off about 8.0% intraday — following the company’s disappointing quarterly earnings report. The downturn may present a transports headwind across the next session or two.
Similarly, the Financial Select Sector SPDR — also profiled Sept. 15 — has violated a key technical level.
Specifically, the group has gapped under its 50-day moving average, currently 37.46, a recent bull-bear inflection point. The downdraft has been fueled by a volume spike.
Tactically, notable resistance spans from 37.22 to 37.46, the former matching the breakdown point. A reversal higher would place the group on firmer technical ground.
Conversely, the 200-day moving average, currently 34.74, is rising toward the group’s range bottom (34.90).
Against this backdrop, the Invesco QQQ Trust tracks the Nasdaq 100 Index offering a large-cap technology sector proxy.
Technically, the shares have gapped under trendline support and the 50-day moving average, pressured amid a volume spike.
Still, the shares have thus far maintained the August low, exhibiting relative strength versus the other sectors.
Tactically, a swift reversal atop gap resistance (369.25) and the trendline, circa 375 would neutralize the September downdraft.
Conversely, a violation of the August low (359.96) would mark a material “lower low” confirming the prevailing trend shift.
Industrials and Materials violate major support
Beyond the sector leaders, the September downdraft has inflicted material damage elsewhere. The industrials and materials exemplify the backdrop:
To start, the Industrial Select Sector SPDR has tagged nearly six-month lows, extending to challenge the 200-day moving average, currently 98.03.
The group has trended atop the 200-day since August 2020. An eventual violation would raise a technical red flag.
Meanwhile, the Materials Select Sector SPDR has violated major support (80.75) closely matching the 200-day moving average, currently 80.17.
Tactically, a swift reversal atop the 80.75 area would place the brakes on bearish momentum.
Conversely, a violation of the July low (78.68) would punctuate a bearish double top — defined by the May and August peaks — and signal a primary trend shift.


