Charting a bull-trend pullback, S&P 500 retests major support
Focus: Nvidia's earnings-fueled breakout, Ford Motor takes flight, NVDA, F, PSX, VEEV
U.S. stocks are mixed early Thursday, vacillating ahead of the marquee monthly U.S. jobs report, due out Friday.
Against this backdrop, the major benchmarks have extended a modest pullback from the June peak, pressured amid selling pressure that has thus far inflicted limited technical damage.
Editor’s Note: As always, updates can be directly accessed at chartingmarkets.substack.com. Your smartphone can also access updates at the same address.
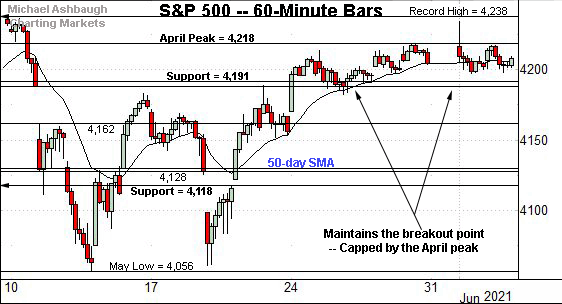
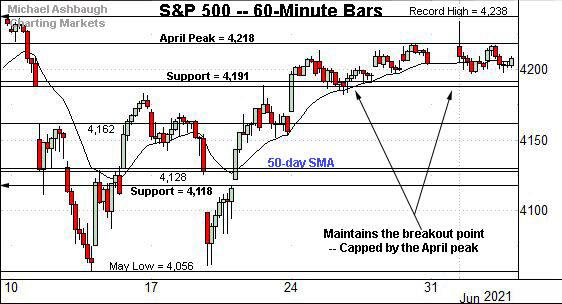
Before detailing the U.S. markets’ wider view, the S&P 500’s hourly chart highlights the past four weeks.
As illustrated, the S&P remains capped by the April peak (4,218).
Wednesday’s session high (4,217.4) registered just under resistance.
More immediately, the S&P has ventured under major support (4,191) Thursday.
The early session high (4,191) matched the inflection point. As always, it’s the session close that matters.
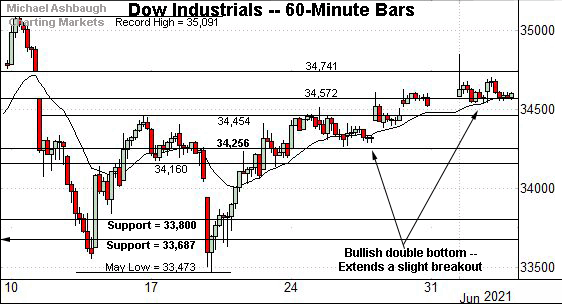
Meanwhile, the Dow Jones Industrial Average has extended its breakout in grinding-higher form.
Tactically, the May gap (34,572) is followed by the former range top (34,454) and a firmer floor at the April peak (34,256).
The prevailing upturn originates from a successful test of the April peak (34,256).
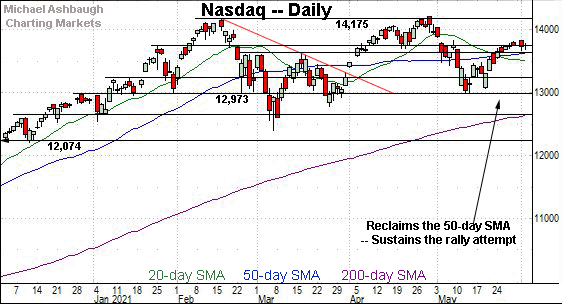
Against this backdrop, the Nasdaq Composite has balked at next resistance.
Tactically, the June 1 peak (13,836) roughly matched the Nasdaq’s one-month range top (13,828), detailed previously.
Conversely, the 50-day moving average, currently 13,636, is followed by the March peak (13,620), a familiar intermediate-term bull-bear inflection point.
Widening the view to six months adds perspective.
On this wider view, the Nasdaq is traversing a four-month range. Market bulls will point to a developing double bottom defined by the March and May lows.
Conversely, market bears will point to a modified double top defined by the February and April peaks.
Within the range, the 50-day moving average, currently 13,636, and the March peak (13,620) remain bull-bear inflection points.
The prevailing upturn originates from a nearly 8-to-1 up day — and has been punctuated by follow-through atop the March peak — signaling a bullish-leaning bias. (In this context, an 8-to-1 up day means advancing volume surpassed declining volume by a nearly 8-to-1 margin.)
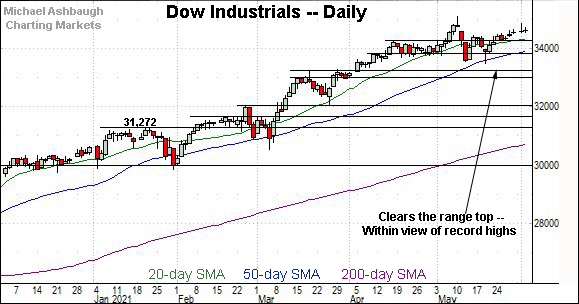
Looking elsewhere, the Dow industrials’ backdrop remains comparably straightforward.
As illustrated, the index continues to grind higher amid four straight double-digit moves.
The prevailing upturn places the Dow’s record close (34,777.76) and absolute record peak (35,091.56) within view.
Conversely, the April peak (34,256) remains a downside inflection point, also detailed on the hourly chart.
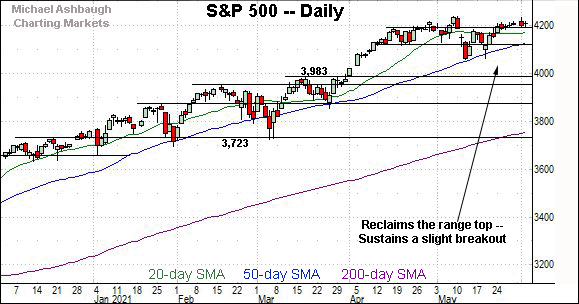
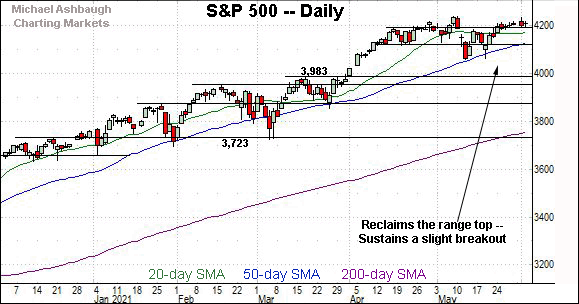
Meanwhile, the S&P 500 is vying to sustain a modest late-May breakout.
Tactically, a familiar inflection point rests in the 4,188-to-4,191 area.
The bigger picture
As detailed above, the major U.S. benchmarks are off to a flattish, but thus far still constructive June start.
Each index continues to digest a modest late-May breakout.
Recall the rallies from major support — S&P 4,191, Dow 34,256 and Nasdaq 13,620 — illustrated on the hourly charts.
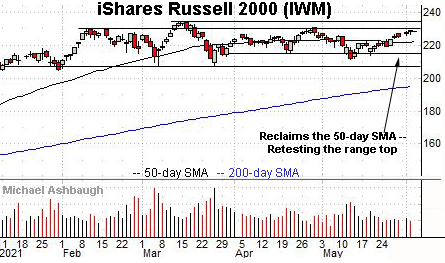
Moving to the small-caps, the iShares Russell 2000 ETF remains range-bound.
To reiterate, notable overhead spans from 230.30 to 230.95, levels matching the February and April peaks.
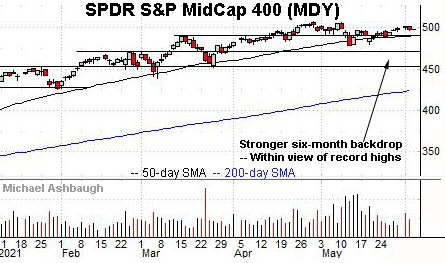
Against this backdrop, the SPDR S&P MidCap 400 remains comparably stronger.
Tactically, the 50-day moving average, currently 490.65, is followed by the MDY’s former breakout point (489.50).
Placing a finer point on the S&P 500, the index is vying to sustain its late-May breakout.
To reiterate, the index has ventured under major support (4,191) early Thursday.
The prevailing pullback punctuates a tight, nearly two-week range, capped by the April peak (4,218).
More broadly, the S&P 500 has flatlined in the wake of a May volatility spike.
Tactically, the 50-day moving average, currently 4,132, is closely followed by the former range bottom (4,118). A violation of this area would raise a technical question mark.
Delving deeper, the May low (4,056) marks a more important floor. An eventual violation would mark a “lower low” — combined with a violation of the 50-day moving average — raising an intermediate-term caution flag.
Beyond specific levels, the major U.S. benchmarks have thus far registered largely uneventful turn-of-the-month price action. The S&P 500’s intermediate-term bias remains bullish, based on today’s backdrop.
The response to Friday’s monthly U.S. jobs report will likely add color.
Watch List
Drilling down further, consider the following sectors and individual names:
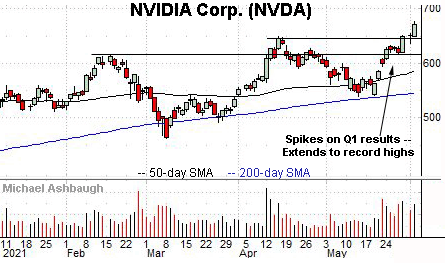
Initially profiled Tuesday, Nvidia Corp. has broken out, knifing to record highs.
The upturn builds on last week’s earnings-fueled strong-volume spike. An intermediate-term target projects to the 745 area.
Conversely, the breakout point (645.50) pivots to well-defined support. A sustained posture higher signals a firmly-bullish bias.
More broadly, the prevailing upturn punctuates a successful test of the 200-day moving average at the May low.
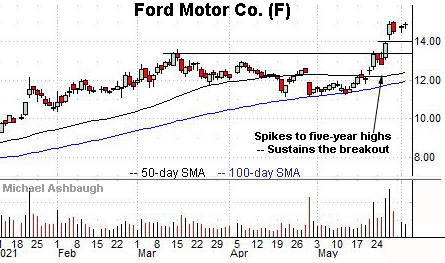
Ford Motor Co. is a well positioned large-cap name.
Late last month, the shares knifed to five-year highs, rising after the company’s update on its electric vehicle strategy. Several positive analyst notes followed.
More immediately, the shares are higher early Thursday, rising after the company’s strong May sales report, including its best May SUV sales since 2003.
Technically, the prevailing flag pattern — the tight three-session range — positions the shares to build on the initial spike. A sustained posture atop the post-breakout low (14.40) and gap support (13.95) signals a bullish firmly-bullish bias.
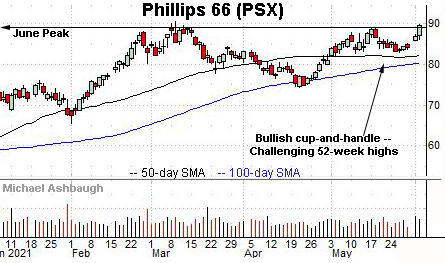
Phillips 66 is a well positioned large-cap oil and gas name. (Yield = 4.2%.)
As illustrated, the shares have rallied to tag a nominal 52-week closing high. The prevailing upturn punctuates a cup-and-handle defined by the April and May lows. (Also see the inverse head-and-shoulders pattern.)
Tactically, a near-term target projects to the 95 area.
Conversely, the breakout point (89.00) is followed by the May range bottom (83.05).
More broadly, the shares are well positioned on the two-year chart, vying to escape pandemic-zone territory. Recall that West Texas Intermediate (WTI) and Brent crude oil prices have tagged their highest levels this week since 2018.
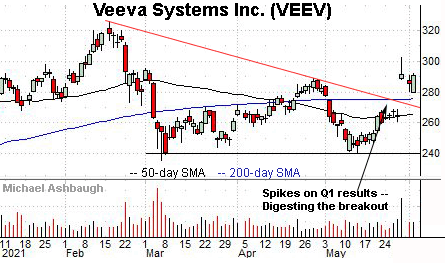
Finally, Veeva Systems, Inc. is a large-cap provider of cloud-based solutions to the life sciences industry.
Late last month, the shares gapped atop trendline resistance, rising after the company’s first-quarter results.
The subsequent pullback has been orderly, placing the shares 4.0% under the May peak.
Tactically, the post-breakout low (280.00) is closely followed by the 200-day moving average, currently 275.70. The recovery attempt is intact barring a violation.


