Charting a bull-bear stalemate, S&P 500 hesiates at major resistance
Focus: Latin America's technical breakout, Solar sector's trend shift, Crude oil and Silver retain bullish backdrop, ILF, USO, SLV, TAN, FCX, KR
Technically speaking, the major U.S. benchmarks seem to have stabilized, at least for now, largely treading water following an aggressive spike from the March low.
Against this backdrop, the S&P 500 has sustained a break to one-month highs, though it continues to challenge major resistance in the 4,475-to-4,495 area. Selling presure near resistance has thus far been muted.
Editor’s Note: As always, updates can be directly accessed at https://chartingmarkets.substack.com.
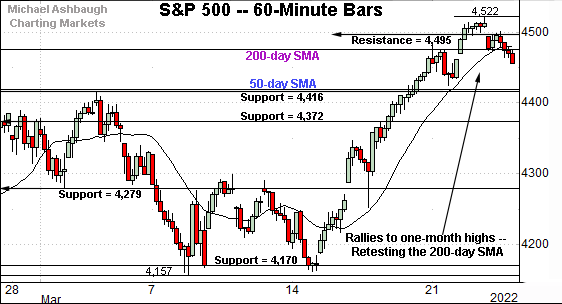
Before detailing the U.S. markets’ wider view, the S&P 500’s hourly chart highlights the past four weeks.
As illustrated, the S&P is digesting a break to one-month highs.
Tactically, an extended test of the 200-day moving average, currently 4,475, remains underway.
Slightly more distant resistance (4,495) is better illustrated on the daily chart.
Similarly, the Dow Jones Industrial Average is consolidating a break to one-month highs.
Two overhead inflection points — detailed previously — remain in play:
Major resistance (34,820) also detailed on the daily chart.
The slightly more distant 200-day moving average, currently 34,974.
Separately, an extended test of the 50-day moving average, currently 34,407, remains underway.
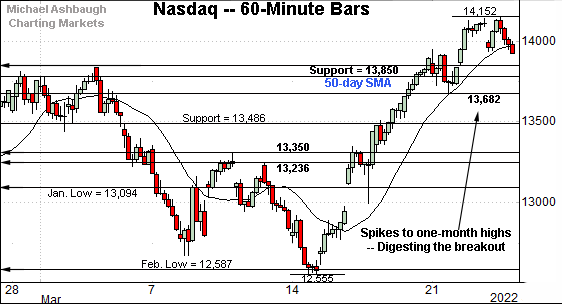
Against this backdrop, the Nasdaq Composite has also sustained a recent breakout.
Tactically, familiar inflection points pivot to support:
The former breakdown point (13,850).
The 50-day moving average, currently 13,787.
Conversely, the Nasdaq has topped just under major resistance (14,175) an area detailed on the daily chart below.
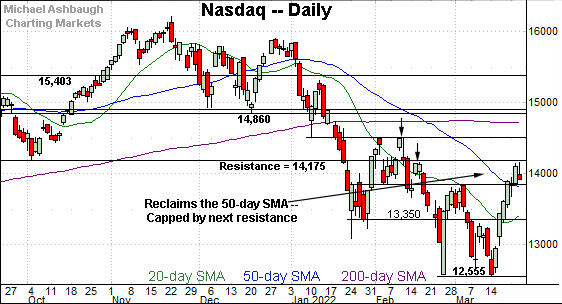
Widening the view to six months adds perspective.
On this wider view, the Nasdaq has extended its rally attempt, rising atop the breakdown point (13,850) and the 50-day moving average.
The breakout marks a “higher high” raising the flag to a trend shift. The Nasdaq’s intermediate-term bias remains guardedly bullish-leaning barring a violation of the 13,850 area.
Separately, the prevailing upturn has thus far been capped by major resistance (14,175) matching the late-2021 range bottom. The week-to-date peak (14,152) has registered in the vicinity.
On further strength, more distant overhead matches the Feb. peak (14,509).
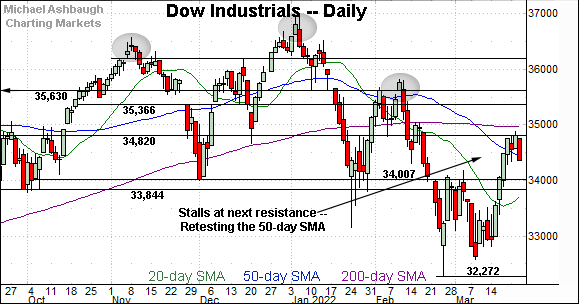
Looking elsewhere, the Dow Jones Industrial Average has reached a higher plateau.
Tactically, the prevailing upturn has been capped by major resistance (34,820), detailed previously.
The March closing peak (34,807) has registered nearby.
Conversely, the Dow’s former breakdown point (34,007) pivots to support. The prevailing recovery attempt is intact barring a violation of this area.
Within the range, an extended test of the 50-day moving average, currently 34,407, remains in play.
Meanwhile, the S&P 500 remains the strongest of the big three U.S. benchmarks.
This is the only index to reach its 200-day moving average, currently 4,475.
Slightly more distant overhead matches the January breakdown point (4,495).
The bigger picture
As detailed above, the major U.S. benchmarks seem to have stabilized, at least for now, vacillating amid recently decreased volatility.
Against this backdrop, each index is digesting a break to one-month highs.
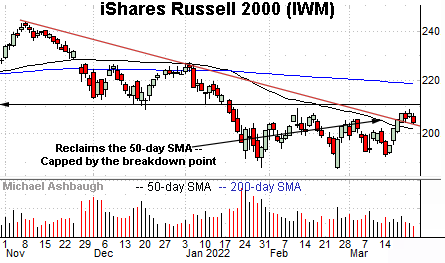
Moving to the small-caps, the iShares Russell 2000 ETF has also turned higher.
The prevailing upturn places it atop trendline resistance roughly tracking the 50-day moving average, currently 201.50.
On further strength, the Feb. peak (209.05) is followed by the firmer breakdown point (211.10).
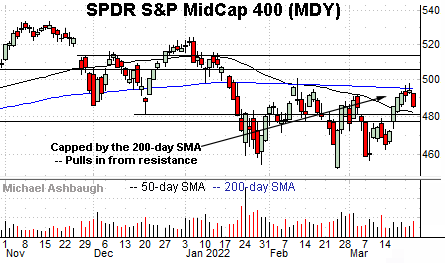
Meanwhile, the SPDR S&P MidCap 400 ETF remains comparably stronger than the Russell 2000.
Nonetheless, the MDY has thus far balked at its 200-day moving average, currently 495.24. Recall the 200-day capped the February rally attempt.
Tactically, follow-through atop the 200-day moving average would punctuate a material “higher high” strengthening the bull case.
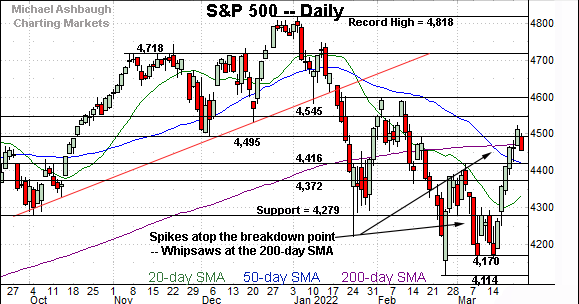
Placing a finer point on the S&P 500, its prevailing backdrop is actually relatively straightforward.
Tactically, the breakout point (4,416) pivots to support, a level matching the 50-day moving average, also currently 4,416.
An eventual violation of this area would raise a caution flag. (The S&P has registered four consecutive daily closes higher.)
More broadly, the S&P 500 has whipsawed at its 200-day moving average, currently 4,475.
Slightly more distant overhead matches the January breakdown point (4,495).
As detailed previously, the 4,475-to-4,495 area marks a potentially consequential technical test. As always, the 200-day moving average is a widely-tracked longer-term trending indicator. (See the February price action, as a bull-bear inflection point.)
Nonetheless, the S&P 500 has thus far drawn distinctly muted selling pressure near resistance, despite its still extended posture following the massive spike from the March low.
Tactically, sustained followed through atop the 4,475-to-4,495 area would signal a bullish-leaning longer-term bias. The prevailing retest of this area, and the weekly close, will likely add color.
Watch List
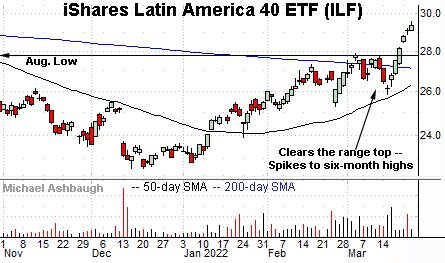
Drilling down further, the iShares Latin America 40 ETF (ILF) has come to life, rising at least partly amid surging commodity prices.
In the process, the shares have knifed to six-month highs, placing distance atop the 200-day moving average.
Tactically, the breakout point (27.75) pivots to support. The prevailing rally attempt is intact barring a violation.
More broadly, notice the pending golden cross — or bullish 50-day/200-day moving average crossover — an event signaling the intermediate-term uptrend has overtaken the longer-term trend.
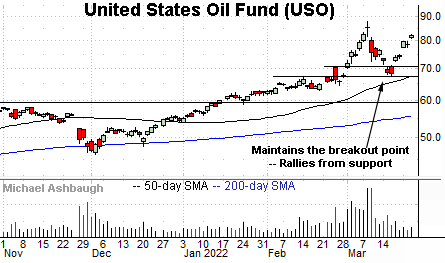
Moving to commodities, the United States Oil Fund (USO) is acting well technically. The fund tracks the spot price of light, sweet crude oil.
Earlier this month, the shares staged a strong-volume breakout, rising to punctuate a massive 90.3% rally from the December low.
The subsequent pullback has been fueled by decreassed volume — and underpinned by the breakout point (66.90) — improving the chances of eventual upside follow-through.
Tactically, the 50-day moving average is rising toward support. A sustained posture atop this area signals a bullish intermediate-term bias. (Also see the March 15 review.)
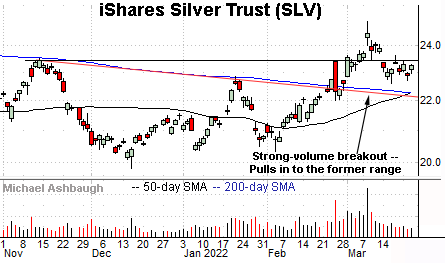
Looking elsewhere, the iShares Silver Trust (SLV) is acting well technically.
The shares started March with a strong-volume breakout, knifing to nine-month highs.
The subsequent pullback, to the former range, has been fueled by decreased volume. Tactically, trendline support closely tracks the 200-day moving average. A sustained posture higher signals a firmly-bullish bias.
Conversely, the range top (23.40) marks an overhead inflection point. Follow-through higher likely opens the path to a retest of the March peak (24.90).
Also consider that a golden cross — or bullish 50-day/200-day moving average crossover — has signaled Thursday.
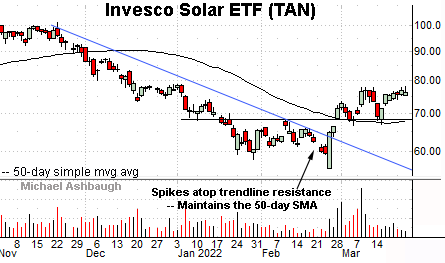
Moving to a U.S. sector, the Invesco Solar ETF (TAN) has come to life, rising in sympathy with the March crude-oil price spike. (See the USO’s chart.)
Late last month, the group knifed atop trendline resistance — and the 50-day moving average — rising amid a volume spike.
The subsequent pullback has been comparably flat — fueled by decreased volume — likely positioning the group to extend the rally attempt.
Tactically, well-defined support matches the breakout point (68.30) and the 50-day moving average, currently 67.88. The group’s recovery attempt is intact barring a violation.
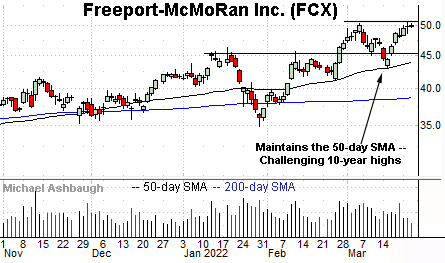
Moving to specific names, Freeport-McMoRan Inc. (FCX) is a large-cap copper and gold miner coming to life.
As illustrated, the shares have maintained the 50-day moving average, rising to challenge the range top. (The March low registered within a penny of the 50-day moving average, and the late-February low registered within 14 cents.)
The prevailing upturn places 10-year highs under siege.
Tactically, the shares have ventured early Thursday above the range top (50.45). An intermediate-term target projects to the 58.00 area on follow-through.
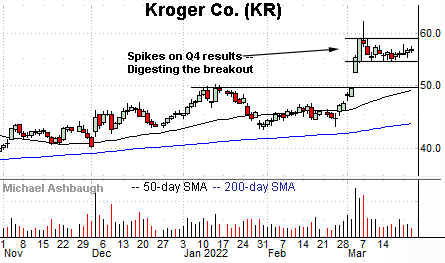
Finally, Kroger Co. (KR) is a well positioned large-cap name. (Yield = 1.5%.)
Earlier this month, the shares knifed to all-time highs, rising after the company’s strong fourth-quarter results.
The subsequent pullback has been comparably flat, placing the shares 10.8% under the March peak.
Tactically, the prevailing flag-like pattern — hinged to the early-March spike — positions the shares to build on the breakout. The rally attempt is intact barring a violation of the range bottom (54.25).


