Bearish momentum persists, S&P 500 whipsaws at key levels
Focus: Nasdaq Composite ventures back under its breakdown point (14,175), Russell 2000 stalls at the neckline
Technically speaking, the major U.S. benchmarks continue to convulse amid a volatile 2022 start.
Against this backdrop, the S&P 500 has whipsawed at major resistance — the 4,545 area — amid bigger-picture technicals that are not one-size-fits-all.
Editor’s Note: As always, updates can be directly accessed at https://chartingmarkets.substack.com. (Experimenting with a new layout on the Charting Markets main page.)
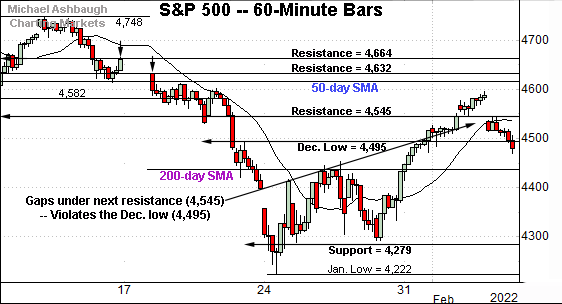
Before detailing the U.S. markets’ wider view, the S&P 500’s hourly chart highlights the past four weeks.
As illustrated, the S&P has whipsawed at next resistance (4,545) an area also illustrated on the daily chart.
Thursday’s session high (4,543) roughly matched resistance to punctuate a failed test from underneath.
More immediately, the subsequent downside follow-through places the S&P back under the December low (4,495).
On further weakness, the 200-day moving average, currently 4,444, remains an inflection point.
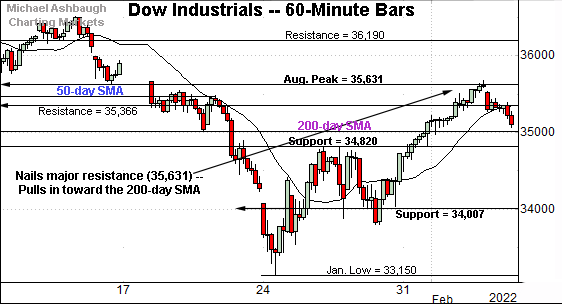
Meanwhile, the Dow Jones Industrial Average has effectively nailed major resistance.
The specific area matches the August peak (35,631) a familiar bull-bear inflection point detailed repeatedly. (Also see the daily chart.)
Wednedsday’s close (35,629) matched resistance, and late-week selling pressure has surfaced.
Perhaps not surprisingly, the Nasdaq Composite remains the weakest major benchmark.
Tactically, the index has topped slightly under the early-January low (14,530), an area also illustrated below.
The subsequent gap lower places the index back under its breakdown point (14,175). Both areas are also illustrated below.
(The Nasdaq has also topped firmly under its 200-day moving average, unlike the other major benchmarks.)
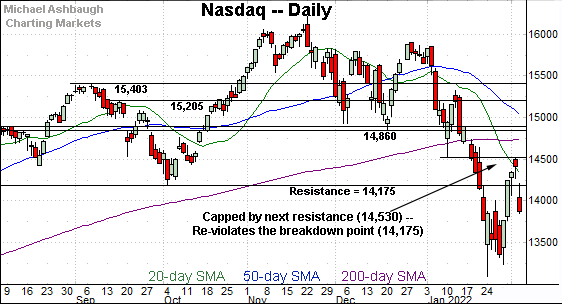
Widening the view to six months adds perspective.
On this wider view, the Nasdaq has whipsawed this week at its breakdown point (14,175).
Recall the breakdown point matches the February 2021 peak (14,175), the July low (14,178) and the October low (14,181).
The Nasdaq’s swift reveral back under the breakdown point is distinctly bearish, and suggests the prior rally attempt “was what we thought it was” to loosely coin a phrase from the late Dennis Green. (That is to say the prior rally attempt looked poorly-grounded, in some respects, as detailed Wednesday.)
Tactically, the prevailing downturn punctuates a failed test of the early-January low (14,530). Sustained follow-through atop the breakdown point (14,175) would mark a step toward stabilization.
Looking elsewhere, the Dow Jones Industrial Average has nailed major resistance.
To reiterate, Wednedsday’s close (35,629) matched resistance (35,630), and the index has subsequently pulled in.
Tactically, the 200-day moving average, currently 35,008, is followed by familiar support in the 34,820 area. Recall last week’s high (34,815) closely matched the latter.
Meanwhile, the S&P 500 is off to an equally volatile 2022 start.
Amid the cross currents, the prevailing whipsaw has been punctuated by a fleeting false break atop major resistance (4,545). Three recent inflection points have matched resistance:
Tuesday’s session close (4,546).
Wednesday’s session low (4,544).
Thursday’s session high (4,543).
Separately, the prevailing pullback places the S&P’s breakdown point (4,495), back in play. This level partly defines the S&P’s double top, the “M” formation, defined by the November and January peaks.
The bigger picture
As detailed above, the major U.S. benchmarks continue to convulse amid a volatile 2022 start.
Against this backdrop, the prevailing bigger-picture backdrop remains bearish-leaning, on balance, though it is not one-size-fits-all.
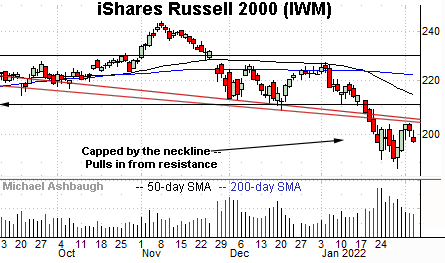
Moving to the small-caps, the iShares Russell 2000 ETF is digesting its technical breakdown.
Recall last month’s strong-volume downdraft punctuated a head-and-shoulders top, defined by the September, November and January peaks. As always, the head-and-shoulders top is a high-reliability bearish reversal pattern.
More immediately, the recent upturn has stalled near the pattern’s neckline, to punctuate a lackluster lighter-volume rally attempt. Bearish price action.
The failed technical test places the small-cap benchmark in a much less-charted patch — illustrated on the five-year chart — leaving it vulnerable to potential downside follow-through.
Similarly, the SPDR S&P MidCap 400 ETF has asserted a bearish six-month backdrop.
Tactically, the recent rally attempt has been fueled by decreased volume. The MDY has struggled to sustain follow-through atop the breakdown point (477.50).
More broadly, notice the pending death cross, or bearish 50-day/200-day moving average crossover. Recall the Russell 2000’s January downdraft accelerated amid a death cross.
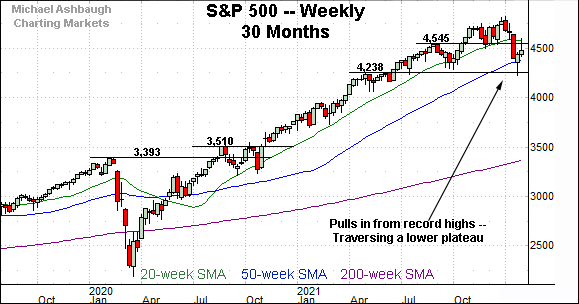
Returning to the S&P 500, this next chart is a weekly view, spanning 30 months. Each bar on the chart represents one week.
As illustrated, the S&P has whipsawed in the wake of an aggressive downdraft from its record high (4,818), established Jan. 4, 2022.
The downturn has spanned as much as 470 points, or 9.8%, on a closing basis, nearly reaching the 10% correction milestone.
Against this backdrop, the S&P 500 is traversing a lower plateau, loosely defined by two 2021 inflection points — the 4,238 and 4,545 areas.
Tactically, trading ranges are more frequently exited in the direction in which they were entered. In this case, the door remains open to potential downside follow-through.
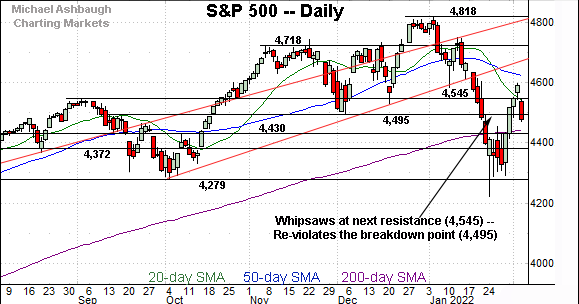
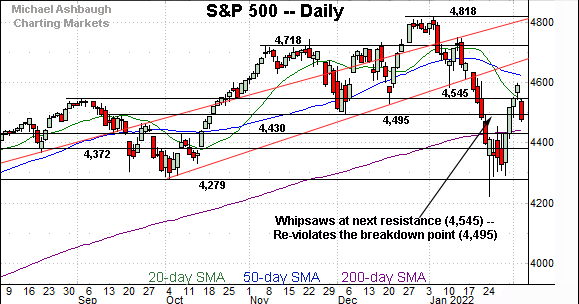
Returning to the S&P 500’s daily chart, recall resistance also detailed on the weekly view previously — the 4,545 area.
To reiterate, three week-to-date inflection points have matched the 4,545 resistance:
Tuesday’s session close (4,546).
Wednesday’s session low (4,544).
Thursday’s session high (4,543).
Slightly more broadly, the prevailing swift reversal back under two inflection points — at 4,545 and 4,495 — at least tactically nullifies the near-term rally attempt. The rally attempt can’t be trusted, following a false breakout (4,545), and subsequent violation of deeper support (4,495).
Delving deeper, the S&P 500’s 200-day moving average, currently 4,444, is closely followed by the 4,430 support.
As always, it’s not just what the markets do, it’s how they do it.
But generally speaking, the S&P 500’s longer-term bullish bias is intact barring a violation of the 4,430 area.
(Also see the Feb. 2 review for a more detailed take on recent nearly-historic bearish price action in spots.)


