Charting a bull-bear debate, S&P 500's 11-to-1 up day clashes with primary downtrend
Focus: Market breadth finally registers bullish extremes, though sentiment backdrop barely budges
Technically speaking, the major U.S. benchmarks are vying to stabilize in the wake of this year’s strongest single-day rally internally.
Still, the bullish reversal has registered amid a powerful primary downtrend, raising questions as to the rally attempt’s sustainability. Against this backdrop, one day rarely alters a trend, though the next several sessions may add color.
Editor’s Note: As always, updates can be directly accessed at https://chartingmarkets.substack.com.
Before detailing the U.S. markets’ wider view, the S&P 500’s hourly chart highlights the past four weeks.
As illustrated, the S&P has reversed from 13-month lows.
The prevailing upturn places it back atop the 20-hour moving average, an inflection point amid the downturn. Previous breaks higher have been relatively fleeting.
Tactically, follow-through atop next resistance (4,062) would mark technical progress.
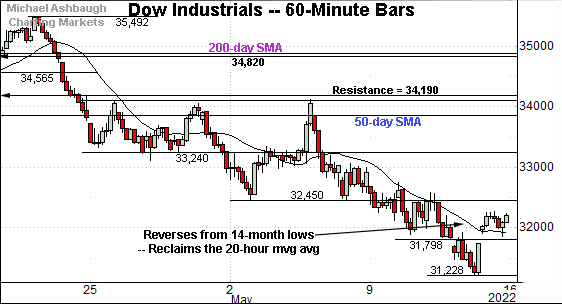
Meanwhile, the Dow Jones Industrial Average has reversed from 14-month lows.
Here again, the upturn places it back atop the 20-hour moving average.
Broadly speaking, the 31,800-to-31,860 area pivots to support. (The 20-hour moving average, currently 31,880, rests nearby.)
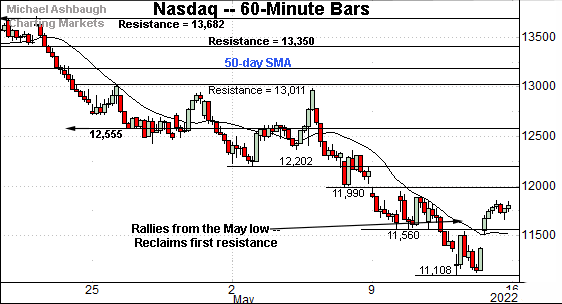
Against this backdrop, the Nasdaq Composite has reversed from 18-month lows.
The prevailing upturn places it back atop first resistance (11,560) an area that pivots to support.
On further strength, more distant overhead matches last week’s high (11,990), and the prior week’s low (11,990).
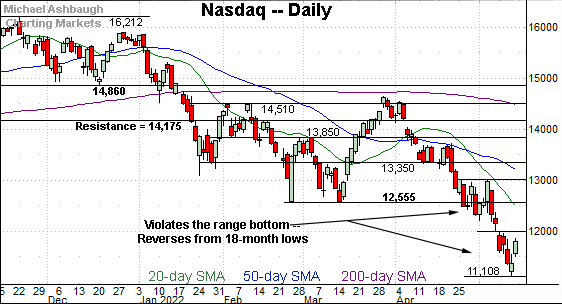
Widening the view to six months adds perspective.
On this wider view, the Nasdaq has reversed respectably from the May low.
Notably, the initial rally registered amid firmly-bullish internals. Friday’s advancing volume surpassed declining volume by a nearly 8-to-1 margin. (Elsewhere, the NYSE registered a nearly 11-to-1 up day.)
More plainly, measurable signs of bullish momentum have surfaced. Still, one day rarely alters a trend, and in this case, the primary downtrend is firmly-entrenched.
Tactically, a comparably aggressive rally over about the next week — another 8-to-1 up day — would raise the flag to a potentially legitimate recovery attempt. Follow-through atop the 12,000 area, and the breakdown point (12,555), would also strengthen the bull case.
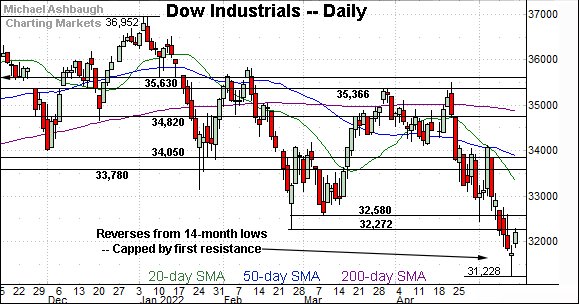
Looking elsewhere, the Dow Jones Industrial Average has also reversed from the May low.
Tactically, first resistance (32,272) matches the February low, detailed repeatedly.
Friday’s session high (32,276) registered nearby.
On further strength, the 32,580 area marks firmer overhead.
Meanwhile, the S&P 500 has also rallied from the May low.
The bullish reversal places it atop the 4,000 mark, though the S&P’s first significant resistance (4,170) remains more distant.
The bigger picture
As detailed above, the major U.S. benchmarks are vying to stabilize in the wake of a damaging year-to-date downdraft. Consider the depth of each benchmark’s pullback from its all-time high:
The S&P 500 has dropped as much as 960 points, or 19.9%.
The Nasdaq Composite has plunged as much as 5,103 points, or 31.5%.
The Dow industrials have eased as much as 5,724 points, or 15.5%.
Amid the downturn, the latest rally attempt — or corrective bounce — registered to conclude last week. Follow-through and sustainability remain open questions.
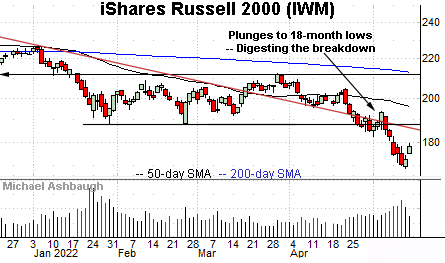
Moving to the small-caps, the iShares Russell 2000 ETF (IWM) is digesting a technical breakdown.
Consider that the early-May downturn was fueled by a sustained volume increase, while the immediate rally attempt has been punctuated by decreased volume.
Tactically, upside follow-through atop trendline resistance and the breakdown point (188.00) would place the brakes on bearish momentum.
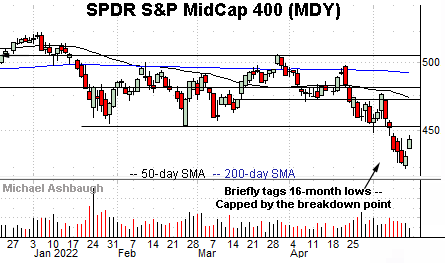
Meanwhile, the SPDR S&P MidCap 400 ETF (MDY) has reversed from 16-month lows.
Here again, the initial rally attempt has been fueled by decreased relative volume.
Tactically, the breakdown point — the 452.90 area — marks notable overhead. The pending retest from underneath may add color.
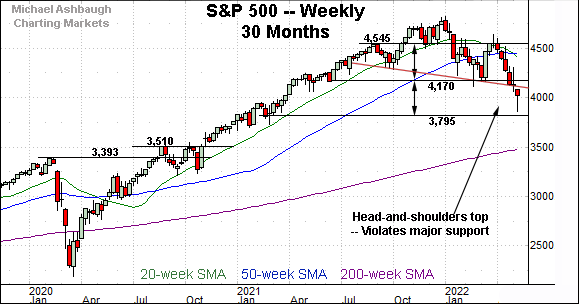
Returning to the S&P 500, this next chart is a weekly view, spanning 30 months. Each bar on the chart represents one week.
As illustrated, the S&P has reached a lower plateau. Recall last week’s downturn punctuated a head-and-shoulders top, defined by the September, January and March peaks.
Tactically, a swift reversal atop major resistance — the 4,130-to-4,170 area — would mark a step toward stabilization.
Conversely, a downside target projects to just under the 3,800 mark, as detailed previously. (See the May 3 review, as well as prior reviews.)
The May low (3,858) — established Thursday — registered within striking distance of the target.
Market breadth finally registers bullish extremes
Moving to market breadth, Friday’s reversal marked the year’s strongest single-day rally internally.
On a headline basis, NYSE advancing volume surpassed declining volume by a nearly 11-to-1 margin.
As always, in a textbook world, two 9-to-1 up days — across about a seven-session window — reliably signals a major trend shift. (The early-2019 rally originated from two 9-to-1 up days across a precisely seven-session window.)
So a comparably aggressive single-day spike — across about the next week — would strengthen the bull case. Based on today’s backdrop, one strong day does not neutralize a powerful downtrend.
Returning to the six-month view, the S&P 500 has reversed respectably from the May low, rising amid a 2.4% single-day spike.
Still, the index is traversing a less-charted patch, and has not yet challenged significant resistance.
Tactically, upside follow-through atop the 4,062 area — and the 4,170 mark — would signal waning bearish momentum. At least for the near-term. (Also see the hourly chart.)
Separately, the CBOE Volatility Index (VIX) is not currently structured to reliably signal that the S&P 500 has established a durable low. Ideally, for market bulls, the VIX would have registered a material “higher high” last week. (See this link detailing the VIX’ backdrop.)
All told, the S&P 500 has shown signs of a pulse — amid a powerful 11-to-1 up day — though the backdrop elsewhere does not currently signal that the low has been established. The quality of this week’s follow-through, or lack thereof, may add color. No new setups today.


