Charting a head-and-shoulders top, S&P 500 whipsaws at key trendline
Focus: Market breadth continues to press bearish extremes amid three 7-to-1 down days
Technically speaking, the major U.S. benchmarks are vying to stabilize ahead of the Federal Reserve’s widely-anticipated policy directive, due out mid-week.
Against this backdrop, the S&P 500 has whipsawed at a key trendline, an area defining the prevailing bull-bear battleground. Monday’s 2.3% bullish reversal punctuated a shaky, but successful, test of major support.
Editor’s Note: As always, updates can be directly accessed at https://chartingmarkets.substack.com.
Before detailing the U.S. markets’ wider view, the S&P 500’s hourly chart highlights the past four weeks.
As illustrated, the S&P has violated major support (4,170), an area also detailed on the daily chart.
Tactically, the breakdown point (4,170) pivots to resistance.
Monday’s session high (4,169.8) registered nearby, and respectable intraday selling pressure surfaced. (See the S&P 500’s weekly chart, in the next section, detailing the broader trendline.)
Similarly, the Dow Jones Industrial Average has extended its downturn.
The prevailing pullback originates from the breakdown point, an area roughly matching the 50-day moving average, currently 34,064.
More immediately, the 33,240 area pivots to resistance.
Meanwhile, the Nasdaq Composite has extended to 17-month lows, its worst level since November 2020.
Recall the prevailing downturn orignates from major resistance (13,680).
From current levels, the 12,555 area marks an inflection point, also illustrated on the daily chart below.
Widening the view to six months adds perspective.
On this wider view, the Nasdaq has tagged 17-month lows, pressured amid a persistent five-week downturn.
To reiterate, the former range bottom (12,555) remains an inflection point.
More broadly, the Nasdaq’s former breakdown point (13,350) marks more distant resistance. Eventual follow-through atop this area would mark a step toward stabilization.
Looking elsewhere, the Dow Jones Industrial Average has briefly tagged two-month lows.
Still, this is the lone major U.S. benchmark to maintain a posture atop the February low.
Tactically, the 50-day moving average, currently 34,064, is descending toward resistance in the 34,050 area.
The post-breakdown peak (34,054) — established Thursday — registered nearby.
Meanwhile, the S&P 500 has violated major support (4,170) an area detailed repeatedly.
To reiterate, the breakdown point (4,170) pivots to resistance.
Monday’s session high (4,169.8) effectively matched resistance.
The bigger picture
Collectively, the major U.S. benchmarks are beginning the worst six months seasonally — May through October — against an already firmly-bearish bigger-picture backdrop.
On a headline basis, each index concluded April with an aggressive downdraft, tagging multi-month lows.
Moving to the small-caps, the iShares Russell 2000 ETF has registered 17-month lows.
Tactically, trendline resistance is descending toward the breakdown point — 187.90-to-188.10 area — detailed previously.
More broadly, the small-cap benchmark has reached a less-charted patch — illustrated on the five-year chart — opening the path to potential downside follow-through.
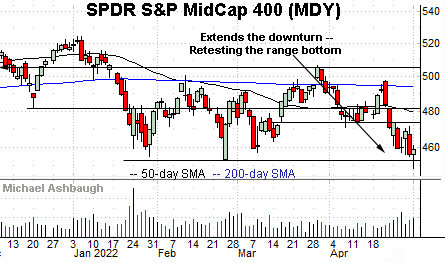
Meanwhile, the SPDR S&P MidCap 400 ETF has thus far maintained its range bottom. The 452.90 area marks notable support.
More broadly, the downturn originates from the 200-day moving average, an area roughly defining its three-month range top. The prevailing range is a bearish continuation pattern, capped by the 200-day.
Market breadth remains a headwind
Moving to market breadth, the recent leg lower has been punctuated by unusually aggressive selling pressure.
More specifically, the downturn has encompassed two 7-to-1 down days — as well as a 6.5-to-1 down day — across a narrow six-session span. (Declining volume surpassed advancing volume by the stated margin.)
As always, in a textbook world, two 9-to-1 down days — across about a seven-session window — reliably signals a major trend shift.
So the prevailing downdraft remains not quite textbook bearish, though the backdrop is consistent with a market vulnerable to incremental downside.
S&P 500 narrowly maintains important support
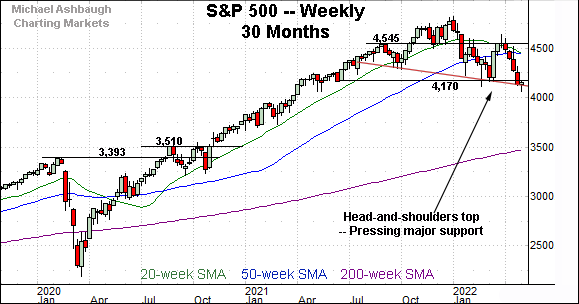
Returning to the S&P 500, this next chart is a weekly view, spanning 30 months. Each bar on the chart represents one week.
As illustrated, the S&P has ventured under major support (4,170), an area detailed repeatedly.
The April close (4,131) registered under support to punctuate the S&P’s worst close in 11 months — since mid-May 2021.
More broadly, the prevailing downturn punctuates a developing head-and-shoulders top, defined by the September, January and March peaks.
Note the April close, established Friday, closely matched the pattern’s neckline.
The S&P 500 ventured under the neckline Monday — positioning it precariously — and subsequently registered a sharp intraday reversal, rising to close 93 points, or 2.3%, above the session low. No immediately apparent catatlyst fueled the intraday rally.
So Monday marked a rabbit-from-hat reversal, averting a potentially damaging market downdraft. At least for now.
Recall a downside target projects to the 3,800 area on a violation of the neckline. (See the April 29 review, as well as prior reviews.)
Returning to the six-month view, the S&P 500 has whipsawed at its range bottom, briefly tagging 11-month lows.
Monday’s bullish reversal — again, spanning 2.3% intraday, from the session low to the close — punctuates an aggressive downdraft from the 200-day moving average.
Tactically, the quality of the prevailing rally attempt (or reflexive bounce) will likely add color. Follow-through atop major resistance — the 4,280 area — would mark a step toward stabilization.
Beyond near-term issues, the S&P 500’s bigger-picture backdrop remains bearish pending more extensive repairs. The response to the Federal Reserve’s mid-week policy statement, and Friday’s monthly jobs report, will likely add color.


