Charting a bull-bear battle, S&P 500 nails major resistance (4,170)
Focus: Nasdaq approaches major resistance (12,270), Silver sustains break to 52-week highs
Technically speaking, the major U.S. benchmarks are off to a grinding-higher second-quarter start.
Amid the upturn, the S&P 500 has tagged major resistance (4,170) — almost precisely — while the Nasdaq Composite is approaching equally significant overhead (12,270). The pending selling pressure in these areas, or lack thereof, should be a useful bull-bear gauge.
Editor’s Note: As always, updates can be directly accessed at https://chartingmarkets.substack.com.
Before detailing the U.S. markets’ wider view, the S&P 500’s hourly chart highlights the past four weeks.
As illustrated, the S&P 500 has tagged two-month highs.
The prevailing upturn places major resistance (4,170) within view, an area illustrated on the daily and weekly charts further down the page.
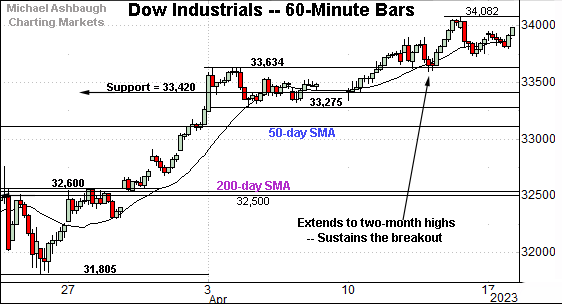
Meanwhile, the Dow Jones Industrial Average has sustained a break to two-month highs, rising from a tight early-April range.
Tactically, the breakout point (33,634) is followed by a firmer floor at 33,420, an area also detailed on the daily chart.
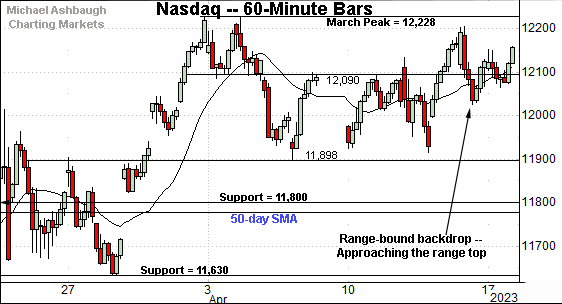
Against this backdrop, the Nasdaq Composite remains range-bound. Nonetheless, range-bound is bullish amid the prevailing market context.
Tactically, the April low (11,898) has underpinned the Nasdaq’s price action across about three weeks.
More broadly, each benchmark concluded March with a spike atop its 50-day moving average, and has since sustained the break higher.
Widening the view to six months adds perspective.
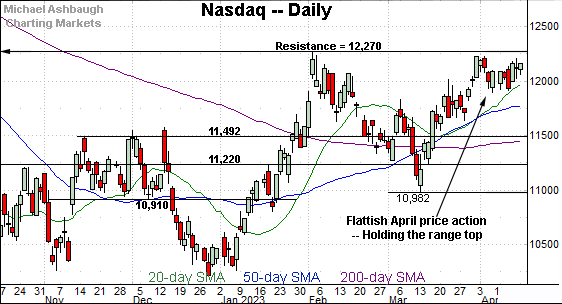
On this wider view, the Nasdaq remains capped by major resistance (12,270). Recall the seven-month range top is defined by the Sept. peak (12,270) and Feb. peak (12,269).
Still, the April selling pressure near resistance has been muted.
Market bulls might point to a developing cup-and-handle — defined by the March and April lows — a pattern hinged to the steep January rally.
Tactically, the April low (11,898) is followed by the 50-day moving average, currently 11,772. An eventual violation would raise a caution flag.
Looking elsewhere, the Dow Jones Industrial Average has extended its April upturn.
From current levels, the former breakdown point (33,420) is followed by the deeper 50-day moving average, currently 33,100. The prevailing rally attempt is intact barring a violation.
More broadly, the index is traversing a prolonged range hinged to the steep October-through-November rally. Constructive price action, in the broad sweep.
Meanwhile, the S&P 500 is approaching a truly headline inflection point.
The specific area matches major resistance (4,170), a level extending back two years, as detailed on the weekly chart in the next section.
The week-to-date peak (4,169.5), established early Tuesday, has matched resistance.
The bigger picture
As detailed above, the major U.S. benchmarks are approaching potentially consequential technical levels.
On a headline basis, the S&P 500 has tagged major resistance (4,170) — almost precisely — while the Nasdaq Composite is approaching its seven-month range top (12,270).
The pending selling pressure in these areas, or lack thereof, should be a useful bull-bear gauge.
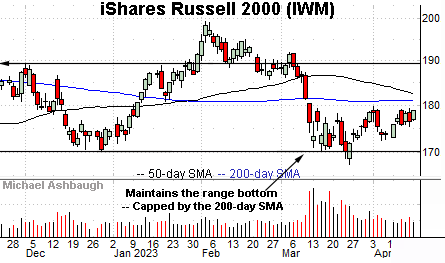
Moving to the small-caps, the iShares Russell 2000 ETF (IWM) remains range-bound.
As detailed repeatedly, the index has maintained major support, an area matching the Dec. low (170.34).
Still, the subsequent rally attempt remains sluggish, fueled by decreased volume, and has been capped by the 200-day moving average, currently 181.15. Eventual downside follow-through remains a prospect based on today’s backdrop.
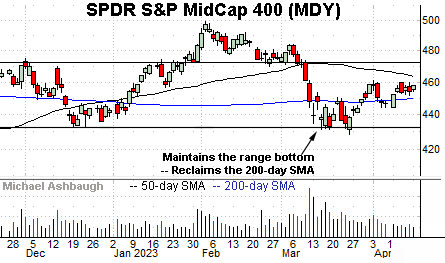
Similarly, the SPDR S&P MidCap 400 ETF (MDY) has registered flattish April price action.
Tactically, the 200-day moving average, currently 450.10, remains an inflection point, an area the MDY has not strayed too far from over the prior six weeks.
More broadly, recall the developing head-and-shoulders top defined by the December, February and April peaks. (Also see the Russell 2000’s backdrop.)
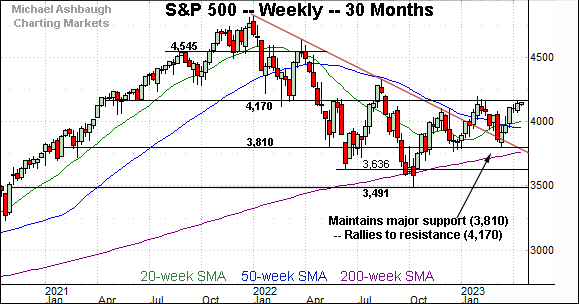
Returning to the S&P 500, this next chart is a weekly view spanning 30 months. Each bar on the chart represents one week.
As illustrated, the S&P has tagged major resistance (4,170) a familiar inflection point, detailed repeatedly. (See for instance, the March 15 review, and the May 3, 2022 review.)
The week-to-date peak (4,169.5) — established early Tuesday — has matched resistance. Selling pressure has at least initially surfaced.
Conversely, recall the prevailing upturn originates from major support (3,810). The March low (3,809) registered nearby.
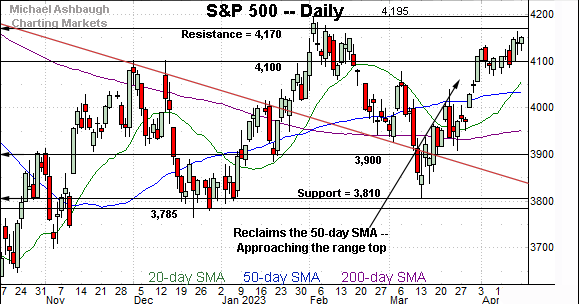
Narrowing to the S&P 500’s six-month view, the index continues to act reasonably well technically.
To reiterate, the prevailing rally originates from major support (3,810) — detailed on the weekly chart — and has subsequently tagged the 4,170 resistance.
Tactically, the 4,100 mark is followed by near-term support (4,070) and the deeper 50-day moving average, currently 4,033. A sustained posture atop the 50-day signals a bullish intermediate-term bias.
More broadly, the S&P 3,945 area remains a bull-bear fulcrum matching familiar inflection points:
The 200-day moving average, currently 3,953.
The mid-point of the former range (3,942).
As always, it’s not just what the markets do, it’s how they do it. But generally speaking, the S&P 500’s bigger-picture bias remains bullish-leaning barring a violation of the S&P 3,945 area.
Beyond technical levels, it’s worth noting that the worst six months seasonally — May through October — are less than two weeks away.
Watch List — Silver sustains second-quarter breakout
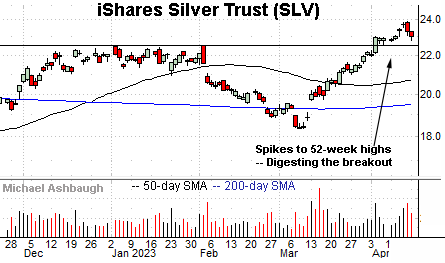
Concluding with a stray note, the iShares Silver Trust (SLV) is acting well technically.
Earlier this month, the shares rallied to 52-week highs, clearing resistance matching the January and February peaks.
The subsequent pullback has been orderly, so far, likely positioning the shares to extend the uptrend. Tactically, the breakout point (22.45) pivots to support. A sustained posture higher signals a comfortably bullish bias.


