Charting a bull-bear battle, S&P 500 challenges major support
Focus: Crude-oil prices stage trendline breakout, Energy and Consumer Staples exhibit strength, Amazon and Alphabet digest breakdowns, USO, XLE, XLP, GOOGL, AMZN
Technically speaking, the major U.S. benchmarks continue to whipsaw amid increased volatility as Treasury yields surge.
Amid the cross currents, the S&P 500 is back for its latest crack at major support — broadly speaking, the 4,130-to-4,170 area — levels matching a potentially consequential bull-bear battleground.
Editor’s Note: As always, updates can be directly accessed at https://chartingmarkets.substack.com.
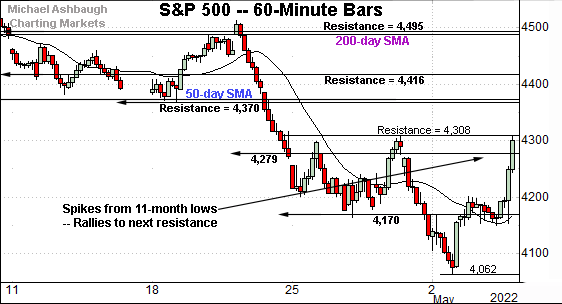
Before detailing the U.S. markets’ wider view, the S&P 500’s hourly chart highlights the past four weeks.
As illustrated, the S&P extended a bullish reversal, initially rising sharply after the Federal Reserve’s policy statement.
The upturn has been capped by next resistance (4,308), detailed previously.
The week-to-date peak (4,307.7) effectively matched resistance.
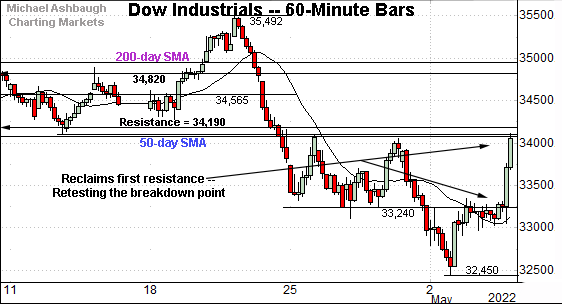
Similarly, the Dow Jones Industrial Average initially spiked after the Fed’s policy statement.
Still, the upturn has been capped by the breakdown point, an area roughly matching the 50-day moving average, currently 34,070.
Wednesday’s session close (34,061) registered nearby. (Also see the daily chart.)
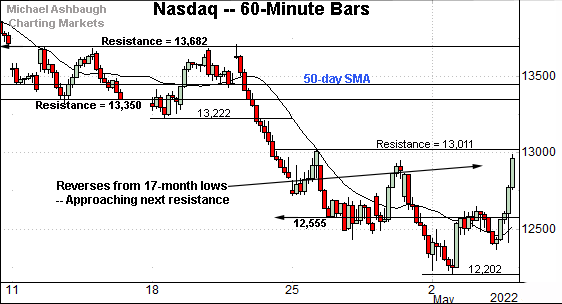
Meanwhile, the Nasdaq Composite also knifed from its range bottom after the Fed. At least initially.
Tactically, familiar resistance (13,011) marks an overhead inflection, detailed previously.
The week-to-date peak (12,985) has registered slightly under resistance.
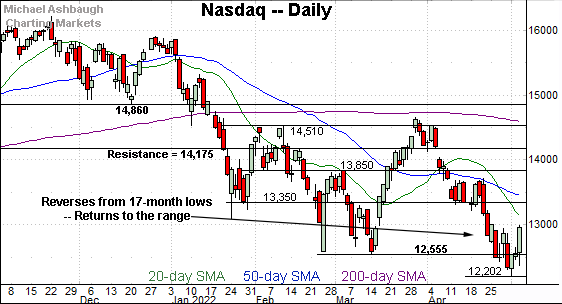
Widening the view to six months adds perspective.
On this wider view, the Nasdaq has whipsawed from the range bottom after briefly tagging 17-month lows.
Tactically, the 12,555 area remains an inflection point. Delving deeper, the year-to-date closing low (12,334) is followed by the May low (12,202).
Beyond specific levels, the Nasdaq’s intermediate- to longer-term bias remains firmly bearish.
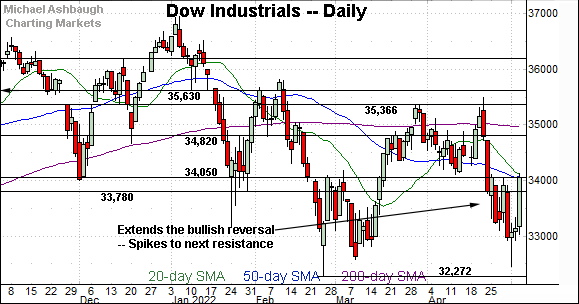
Looking elsewhere, the Dow Jones Industrial Average remains capped by notable resistance.
As detailed previously, the 50-day moving average, currently 34,070, is descending toward resistance in the 34,050 area. (See Tuesday’s review.)
Wednesday’s close (34,061) effectively matched resistance to punctuate a sharp 932-point single-day spike. This area remains a bull-bear inflection point.
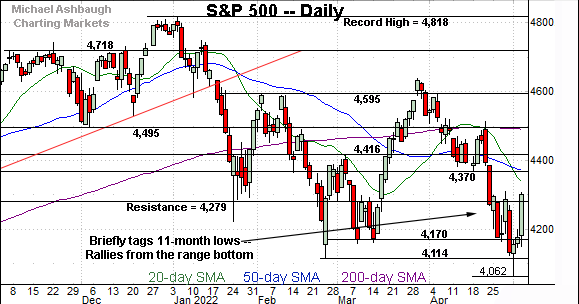
Meanwhile, the S&P 500 extended a bullish reversal after the Fed.
From bottom to top, the three-day rally spanned as much as 245 points, or 6.05%.
The bigger picture
As detailed above, the major U.S. benchmarks continue to whipsaw amid still firmly-bearish bigger-picture price action.
The initial mid-week spike, fueled by the Federal Reserve’s policy statement, is an event known for inducing sometimes spectacular market moves — in either direction — though often with limited lasting technical significance.
Moving to the small-caps, the iShares Russell 2000 ETF has reversed from 17-month lows.
Tactically, trendline support roughly matches the former breakdown point — 187.90-to-188.10 area — detailed previously.
An eventual violation of this area opens the path to a less-charted patch — illustrated on the five-year chart — and potentialy material downside follow-through. The initial retest has concluded with a bull-bear stalemate.
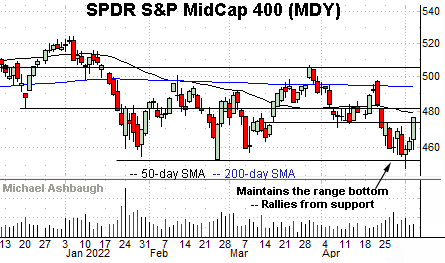
Meanwhile, the SPDR S&P MidCap 400 ETF has maintained its range bottom — the 452.90 area.
More broadly, the MDY is traversing a bearish continuation pattern, effectively capped by the 200-day moving average. The prevailing upturn has been fueled by decreased volume.
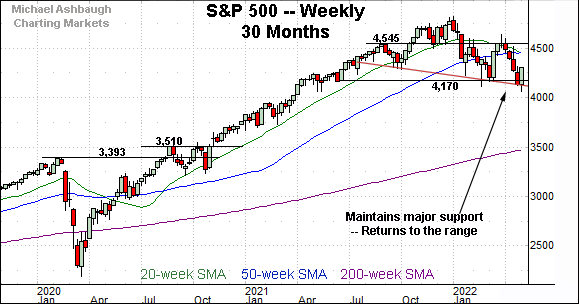
Returning to the S&P 500, this next chart is a weekly view, spanning 30 months. Each bar on the chart represents one week.
As illustrated, the S&P has whipsawed near major support (4,170) to conclude April and start May.
More broadly, the prevailing downturn punctuates a developing head-and-shoulders top, defined by the September, January and March peaks.
The pattern’s neckline roughly matches the April close (4,131).
The April close marked the S&P’s worst close in 11 months — since mid-May 2021 — and the index has subsequently whipsawed amid a precarious backdrop.
Recall a trendline violation opens the path to a downside target in the 3,800 area. (See the April 29 review, as well as prior reviews.)
Returning to the six-month view, the S&P 500 has registered jagged 2022 price action.
Amid the volatility, recall the mid-April peak punctuated a failed test of the 200-day moving average — the 4,495 area — from underneath.
As always, the 200-day moving average is a widely-tracked longer-term trending indicator.
The aggressive downdraft from the mid-April peak spanned 450 points, or 9.99%, across just eight sessions. (The downturn encompassed three 7-to-1 down days, signaling unusually aggressive bearish momentum.)
Moreover, the downturn was punctuated by a “lower low” to conclude April.
More plainly, the hallmarks of a longer-term downtrend — a trend already in play — continue to register with relative frequency, and get relatively high marks for style.
The S&P 500 just staged an aggressive 10% plunge from its 200-day moving average, and has since convulsed amid a corrective bounce. (Meanwhile, bullish market analysts remain relatively abundant, presenting an unfavorable sentiment backdrop.)
Tactically, the S&P 500’s longer-term bias remains bearish, based on today’s backdrop, pending extensive repairs. The response to Friday’s monthly jobs report may add color.
Also see April 29: Charting the S&P 500's precarious backdrop as currency trends accelerate.
Also see April 27: S&P 500 rallies from major support (4,170) even as bigger-picture backdrop deteriorates.
Watch List
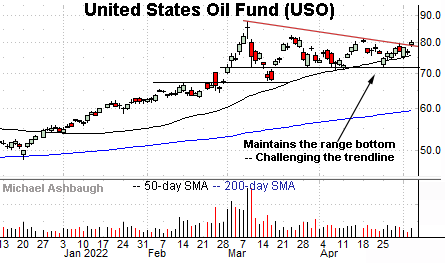
Drilling down further, the United States Oil Fund (USO) is showing signs of life. The fund tracks the spot price of light, sweet crude oil.
As illustrated, the shares have rallied from the range bottom, edging atop trendline resistance.
Tactically, the 50-day moving average, currently 75.90, has marked an inflection point. A breakout attempt is in play barring a violation.
More broadly, recall the steep early-March spike punctuated a massive 90% rally from the December low. The prevailing upturn lays the groundwork for potential upside follow-through on the initial strong-volume rally.
Moving to U.S. sectors, the Energy Select Sector SPDR (XLE) is showing signs of life technically. (Yield = 3.9%.)
As illustrated, the group is challenging seven-year highs, rising amid surging crude oil and natural gas prices.
The prevailing upturn punctuates a successful test of the range bottom (70.40). An intermediate-term target projects to the 92 area on follow-through.
More broadly, the prevailing range top matches major resistance illustrated on the five-year chart. Overhead inflection points match the 2018 peak (79.42) and the April 2022 peak (81.50).
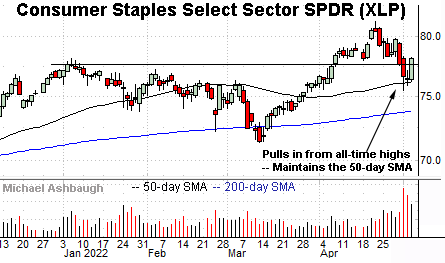
Looking elsewhere, the Consumer Staples Select Sector SPDR (XLP) is acting well technically. (Yield = 2.5%.)
The recent pullback from all-time highs — though admittedly fueled by a volume spike — has thus far inflicted limited damage in the broad sweep.
Tactically, the breakout point (77.60) is followed by the 50-day moving average, currently 76.20, a recent bull-bear inflection point. A sustained posture atop this area signals a bullish bias.
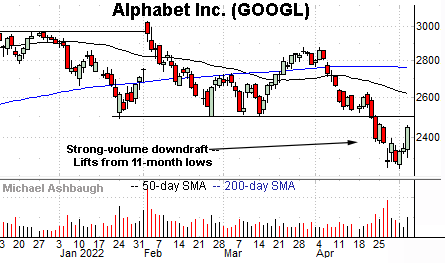
Moving to specific names, name, Alphabet, Inc. (GOOGL) — the parent company of Google — has broken down technically.
The downturn accelerated last week, amid increased volume, after the company’s weaker-than-expected quarterly results.
Tactically, the breakdown point — the 2,490-to-2,499 area — pivots to resistance. A reversal higher would place the brakes on bearish momentum.
(Also see the April 13 review, amid Alphabet’s downturn toward major support.)
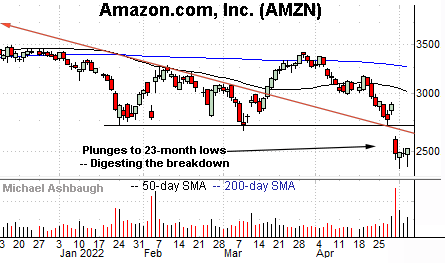
Finally, Amazon.com (AMZN) has also turned lower.
Late last month, the shares gapped to 23-month lows, pressured amid a volume spike after the company’s disappointing quarterly results.
By comparison, the immediate rally attempt has been flattish, fueled by decreased volume. Bearish price action.
More broadly, Amazon is traversing a less-charted patch — hinged to the massive 2020 pandemic-fueled rally — illustrated on the five-year chart. The shares remain vulnerable to potentially material incremental downside.
Tactically, gap resistance (2,615) is followed by the firmer breakdown point (2,715). A reversal atop this area would mark a step toward stabilization.


