Bull trend pauses, U.S. benchmarks digest aggressive November breakout
Focus: Gold miners clear trendline resistance, GDX, CSCO, RNG, ESTC, EGO
U.S. stocks are mixed early Monday, vacillating after a batch of stronger-than-expected economic data out of China.
Against this backdrop, the major U.S. benchmarks remain in consolidation mode amid a still comfortably-bullish bigger-picture backdrop.
Editor’s Note: As always, updates can be directly accessed at chartingmarkets.substack.com.
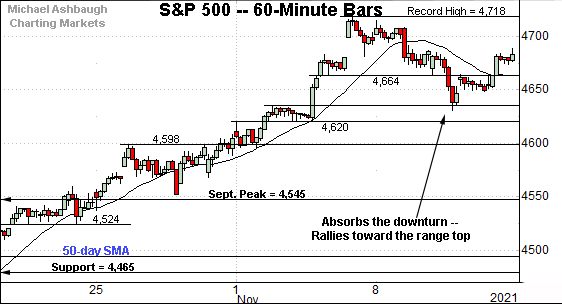
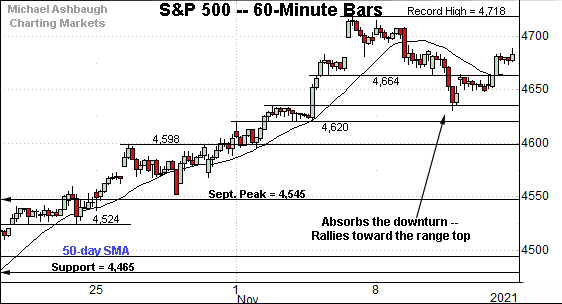
Before detailing the U.S. markets’ wider view, the S&P 500’s hourly chart highlights the past four weeks.
As illustrated, the S&P continues to digest its November spike to record territory.
Tactically, the 4,464 area remains an inflection point and is followed by the early-month breakout point (4,635), a level closely matching last week’s low (4,630).
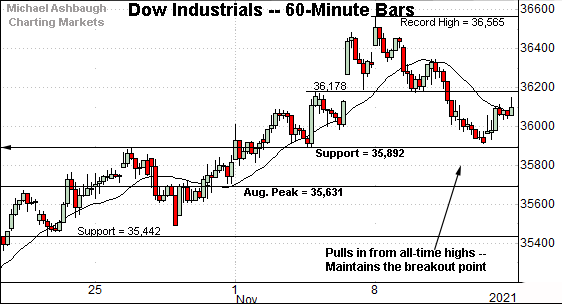
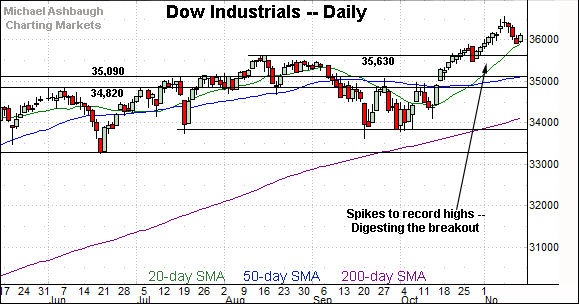
Similarly, the Dow Jones Industrial Average has staged an orderly pullback from record highs.
The mid-month downturn has been underpinned by the breakout point (35,892). Constructive price action.
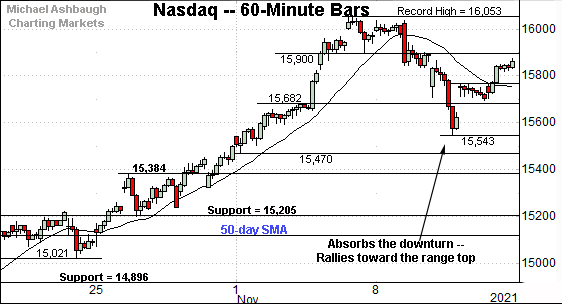
Against this backdrop, the Nasdaq Composite is digesting the most decisive breakout of the big three U.S. benchmarks.
Tactically, near-term support (15,768) is followed by the early-November breakout point (15,682).
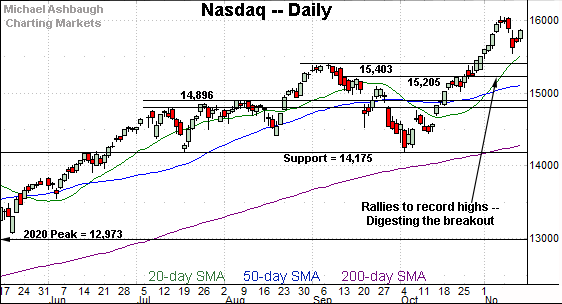
Widening the view to six months adds perspective.
On this wider view, the Nasdaq Composite remains in consolidation mode.
Tactically, the post-breakout low (15,543) is followed by the firmer breakout point — the 15,384-to-15,403 area.
Conversely, an intermediate-term target continues to project to the 16,550 area.
Looking elsewhere, the Dow Jones Industrial Average has also staged an orderly pullback from recent record highs.
The downturn has been underpinned by the 20-day moving average, currently 35,920, a bull-bear inflection point going back as far as August.
Delving deeper, the November peak (36,892) is followed by the firmer breakout point (35,630). (Also see the hourly chart.)
The post-breakout low (36,915) has registered slightly above the former.
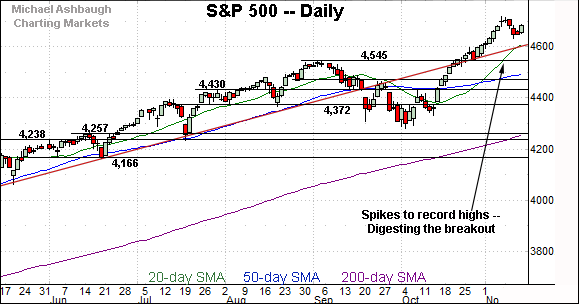
Similarly, the S&P 500 is digesting an aggressive break to record highs.
Recall the strong November start originates from trendline support roughly matching the breakout point (4,545).
The bigger picture
Collectively, the major U.S. benchmarks remain in consolidation mode amid a still comfortably-bullish bigger-picture backdrop.
Each benchmark’s intermediate-term path of least resistance continues to point higher.
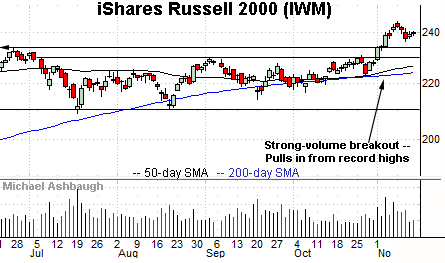
Moving to the small-caps, the iShares Russell 2000 ETF has also sustained its breakout.
As detailed repeatedly, its early-November spike marked a statistically unusual two standard deviation breakout, encompassing six straight closes atop the 20-day volatility bands.
Tactically, the post-breakout low (236.31) is followed by the firmer breakout point (234.50).
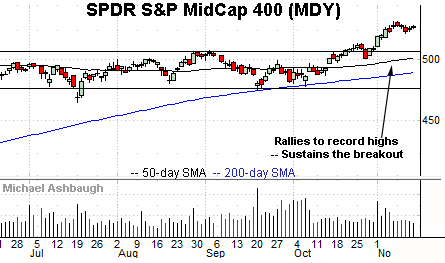
Similarly, the SPDR S&P MidCap 400 ETF has sustained its recent break to record territory.
Its prevailing bull flag — the tight one-week range — is a bullish continuation pattern.
More broadly, the small- and mid-caps’ November breakouts are consistent with broadening market participation.
Placing a finer point on the S&P 500, the index has weathered a modest pullback from recent record highs.
Tactically, the 4,664 area — detailed previously — remains an inflection point.
Conversely, the S&P’s record close (4,701.70) is followed by its absolute record peak (4,718.50).
More broadly, the S&P 500 continues to digest its aggressive 3.4% technical breakout. An overdue near-term consolidation phase remains underway.
Tactically, the post-breakout low (4,630) is followed by trendline support, circa 4,605.
Delving deeper, the S&P’s breakout point (4,545) marks a more important floor.
As always, it’s not just what the markets do, it’s how they do it. But generally speaking, the S&P 500’s backdrop supports a bullish intermediate-term bias barring a violation of the 4,545 area.
Watch List
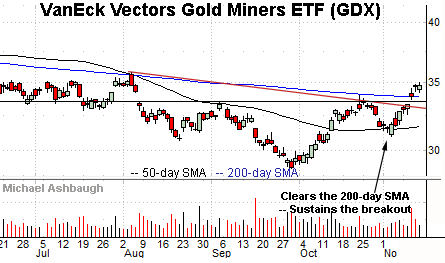
Drilling down further, the VanEck Vectors Gold Miners ETF has come to life technically.
As illustrated, the group has knifed to three-month highs, clearing the 200-day moving average for the first time since June.
The prevailing upturn punctuates a head-and-shoulders bottom defined by the August, September and November lows.
Tactically, the 200-day moving average, currently 33.90, is followed by the breakout point (33.50). The group’s recovery attempt is intact barring a violation.
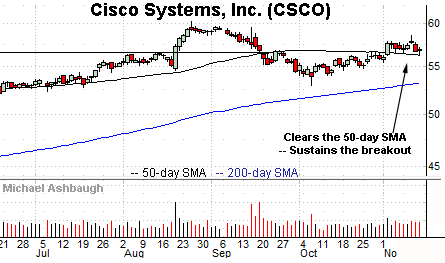
Cisco Systems, Inc. is a well positioned large-cap name. (Yield = 2.6%.)
The shares started November with a breakout, clearing the 50-day moving average on increased volume.
The subsequent tight range is a bullish continuation pattern — underpinned by the 50-day — positioning the shares to build on the early-month breakout.
Tactically, a sustained posture atop the post-breakout low (56.30) and the 50-day moving average, currently 56.24, signals a bullish bias.
Note the company’s quarterly results are due out Wednesday, Nov. 17.
RingCentral, Inc. is a large-cap developer of communications software-as-a-service solutions.
As illustrated, the shares have recently knifed to four-month highs, gapping higher after the company’s strong quarterly results.
The subsequent pullback places the shares 14.9% under the November peak.
Tactically, the post-breakout low (267.55) is followed by the former range top (262.50). The prevailing rally attempt is firmly-intact barring a violation.
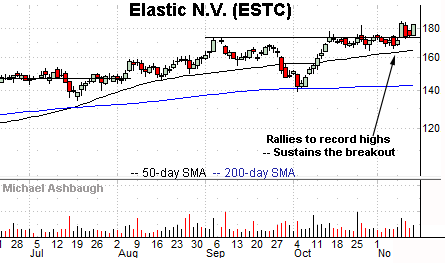
Elastic N.V. is a large-cap developer of search and analytics solutions.
Technically, the shares have recently rallied to record territory, clearing resistance matching the September peak.
The subsequent bull flag is a continuation pattern — and punctuates a previously tight one-month range — laying the groundwork for potentially material longer-term follow-through.
Tactically, a sustained posture atop the breakout point (173.80) signals a comfortably bullish bias.
Finally, Eldorado Gold Corp. is a mid-cap Vancouver-based gold miner.
As illustrated, the shares have tagged four-month highs, rising to challenge the 200-day moving average, currently 10.22. (Consecutive session closes have registered within three cents of the 200-day.)
Tactically, the former range top, circa 10.00, is closely followed by gap support (9.86). A breakout attempt is in play barring a violation.


