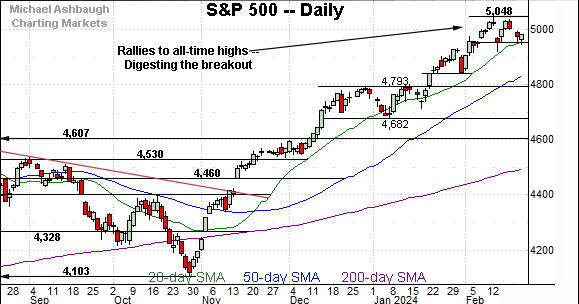
Bull trend intact, S&P 500 absorbs mid-month downdraft
Focus: Dow industrials continue to grind toward 40,000 mark
Technically speaking, the U.S. benchmarks’ bigger-picture backdrop remains bullish even amid recently jagged price action.
On a headline basis, the S&P 500 and Dow industrials have sustained breaks to all-time highs, while the Nasdaq Composite is digesting a rally to two-year highs. The charts below add color:
Editor’s Note: As always, updates can be directly accessed at https://chartingmarkets.substack.com.
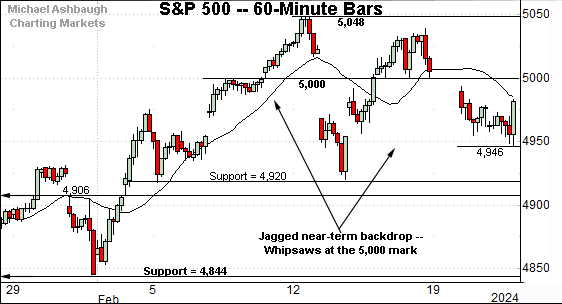
Before detailing the U.S. markets’ wider view, the S&P 500’s hourly chart highlights the past four weeks.
As illustrated, the S&P 500 has whipsawed of late around the 5,000 mark.
Still, the relatively tight February range is contructive, punctuating a modest pullback from all-time highs.
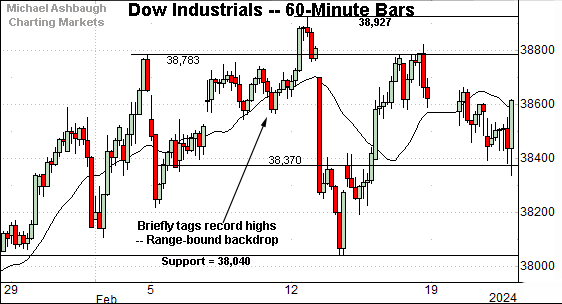
Similarly, the Dow Jones Industrial Average has registered jagged near-term price action.
Here again, the prevailing range is relatively narrow — in the broad sweep — punctuating a modest pullback from record highs. Tactically, the 38,040 area marks its first notable support.
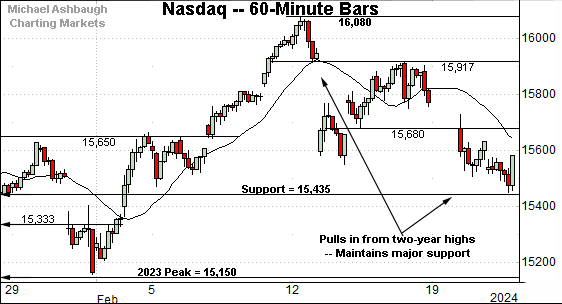
Against this backdrop, the Nasdaq Composite is digesting a rally to two-year highs.
Tactically, the recent pullback has been underpinned by major support (15,435). Delving deeper, the 2023 peak (15,150) remains an inflection point.
Combined, each big three benchmark has registered jagged, and largely sideways, February price action. Nonetheless, range-bound is contructive against the prevailing backdrop.
Widening the view to six months adds perspective.
On this wider view, the Nasdaq has largely sustained a recent break to two-year highs.
Tactically, the 50-day moving average, currently 15,190, is closely followed by the breakout point (15,150). This area remains a bull-bear fulcrum.
(An eventual violation of 15,150 area would mark a “lower low” — combined with a violation of the 50-day moving average — raising a caution flag. Such a move looks unlikely against the immediate backdrop.)
Looking elsewhere, the Dow Jones Industrial Average has recently tagged all-time highs amid a grinding-higher breakout.
Amid the upturn, the marquee 40,000 mark remains within striking distance.
Tactically, the 20-day moving average, currently 38,510, has underpinned the mid-month price action.
Delving deeper, the Dow’s breakout point — the 37,800-to-37,825 area — marks a notable floor. (Note the 50-day moving average has ticked slightly above the breakout point.)
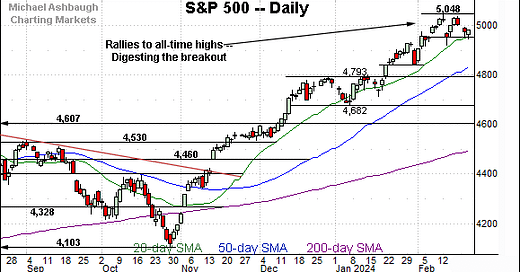
Meanwhile, the S&P 500 has thus far sustained a February breakout.
The prevailing range is effectively hinged to the 5,000 mark, a backdrop also illustrated on the hourly chart.
The bigger picture
As detailed above, the major U.S. benchmarks are acting well technically.
On a headline basis, the S&P 500 and Dow industrials have sustained rallies to all-time highs, while the Nasdaq Composite is digesting a break to two-year highs.
Moving to the small-caps, the iShares Russell 2000 ETF (IWM) continues to lag behind.
As illustrated, the small-cap benchmark remains capped by its range top, a level matching the 2023 peak (205.49).
Nonetheless, the prevailing two-month range marks a bullish continuation pattern, hinged to the mid-December breakout. Tactically, an eventual violation of the breakout point (191.86) and the January low (187.53) would raise a caution flag.
True to recent form, the SPDR S&P MidCap 400 ETF (MDY) remains slightly stronger than the small-caps.
As illustrated, the MDY has recently tagged two-year highs, clearing resistance matching the December peak. (See the preceding bullish continuation pattern.)
Tactically, the breakout point (512.50) is followed by the ascending 50-day moving average, currently 503.90. Recall the 50-day has marked an inflection point going back before the November trendline breakout.
Returning to the S&P 500, the index has asserted an orderly range near all-time highs. The recent price action has not strayed too far from the 5,000 mark, in either direction.
Against this backdrop, it is worth noting that the mid-month downturn — the gap lower to the range bottom — registered as internally aggressive. That session (Feb. 13) marked a 12-to-1 down day, fueled by hotter-than-expected inflation data. (NYSE declining volume surpassed advancing volume by a 12-to-1 margin.)
And as always, in a textbook world, two 9-to-1 down days — across about a seven-session window — reliably signals a material trend shift.
In the present case, the S&P has maintained its range across the subsequent five sessions amid downside follow-through that remains elusive.
So the bull trend is firmly intact, and while it does indeed appear bullet-proof for now, simply note that a comparably aggressive down day — by say, month-end — would raise a technical question mark, if not an outright caution flag.
Near-term issues aside, the S&P 500 continues to act well based on today’s backdrop. One day does not alter a trend.
Tactically, the prevailing range bottom (4,920) is followed by a likely firmer floor (4,844) closely matching the 50-day moving average, currently 4,838.
Delving deeper, the S&P’s breakout point (4,793) likely marks last-ditch support, a level matching the 2021 closing high (4,793) and the absolute 2023 peak (4,793).
As always, it’s not just what the markets do, it’s how they do it. But broadly speaking, the S&P 500’s bigger-picture bias remains bullish barring a violation of the 4,790 area.
Also see Feb. 8: Charting a 2024 breakout, S&P 500 (nearly) tags the 5,000 mark.

