S&P 500 tags 200-day average, hesitates near major resistance
Focus: Latin America sustains breakout, Agribusiness takes flight, Materials sector rattles cage on key resistance, ILF, MOO, XLB, PANW, WMT
Technically speaking, the major U.S. benchmarks have diverged slightly, vacillating amid still surging Treasury yields, and as the April earnings season takes shape.
Amid the cross currents, the S&P 500 has extended a rally from major support (4,370), rising to challenge its marquee 200-day moving average from underneath. The selling pressure in this area, or lack thereof, will likely add color.
Editor’s Note: As always, updates can be directly accessed at https://chartingmarkets.substack.com.
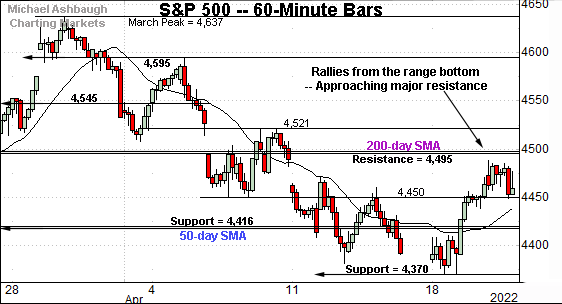
Before detailing the U.S. markets’ wider view, the S&P 500’s hourly chart highlights the past four weeks.
As illustrated, the S&P has extended a rally from major support (4,372).
Recall the April low (4,370), established Monday, registered nearby.
From current levels, major resistance (4,495) closely matches the 200-day moving average, currently 4,497.
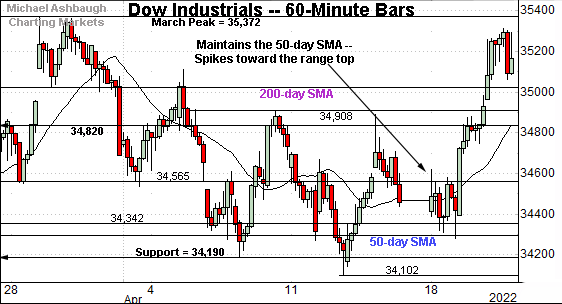
Meanwhile, the Dow Jones Industrial Average has strengthened this week, versus the other benchmarks, knifing toward its range top.
Note the prevailing upturn originates from a “higher low” versus last week’s low, outpacing the other two benchmarks.
Tactically, the March peak (35,372) closely matches major resistance, an area also detailed on the daily chart.
Conversely, the 200-day moving average, currently 35,023, marks a downside inflection point.
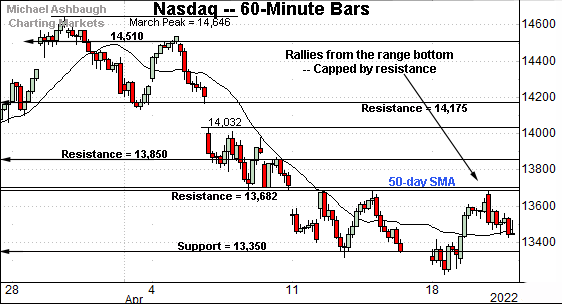
Against this backdrop, the Nasdaq Composite remains the weakest major benchmark.
Still, the index has weathered a jagged test of major support (13,350), an area also detailed on the daily chart.
Last week’s close (13,351) matched support.
Conversely, the prevailing upturn places familiar resistance (13,682) back in play. The 50-day moving average, currently 13,692, roughly matches resistance.
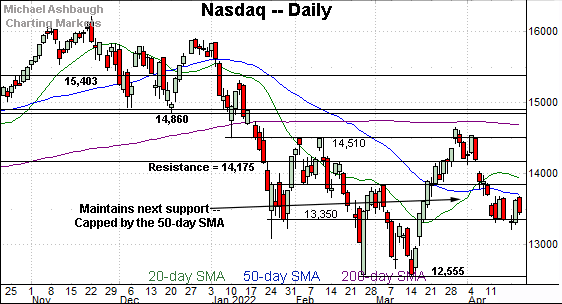
Widening the view to six months adds perspective.
On this wider view, the Nasdaq is traversing a lower plateau.
Tactically, the 50-day moving average, currently 13,692, is followed by the former breakout point (13,850). A rally atop this area would mark technical progress.
Conversely, the prevailing range is underpinned by major support (13,350). Recall last week’s close (13,351) matched support.
More broadly, the Nasdaq’s bigger-picture bias remains bearish based on today’s backdrop.
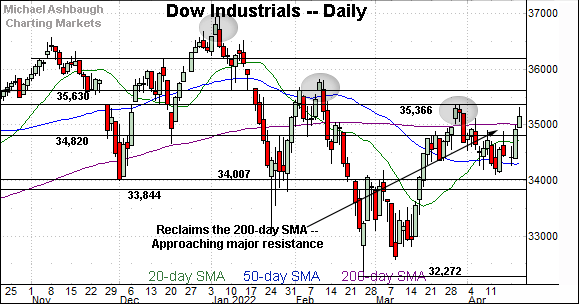
Looking elsewhere, the Dow Jones Industrial Average is showing signs of life technically.
As illustrated, the index has reclaimed its 200-day moving average, currently 35,023, notching just its third close higher across about two months. This area pivots to support. (Note the late-March breakout quickly proved unsustainable.)
Separately, the Dow is approaching major resistance (35,366) a level closely matching the March peak (35,372). Sustained follow-through atop this area would mark a material “higher high” strengthening the bull case.
Slightly more broadly, the Dow has largely maintained its 50-day moving average (in blue), outpacing the Nasdaq Composite.
Meanwhile, the S&P 500 has turned higher from major support (4,372), an area detailed repeatedly.
The April low (4,370) registered nearby.
More immediately, the prevailing upturn places major resistance (4,495) back in play, an area closely matching the 200-day moving average.
The bigger picture
As detailed above, the major U.S. benchmarks continue to diverge slightly, vacillating amid still surging Treasury yields, and as the April earnings season takes shape.
On a headline basis, the Dow industrials are vying to sustain a break atop the 200-day moving average, while the Nasdaq Composite continues to lag firmly behind.
Amid the cross currents, the bigger-picture backdrop remains bearish, on balance, as it applies to the major U.S. benchmarks. Pockets of sector strength persist, as partly detailed in the next section, as well as prior reviews.
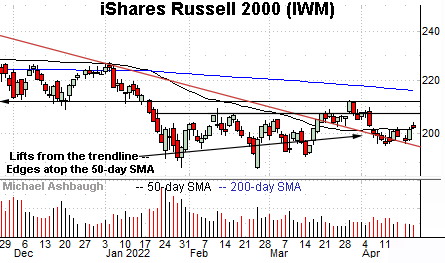
Moving to the small-caps, the iShares Russell 2000 ETF has more or less flatlined in recent weeks.
Amid the sluggishness, the small-cap benchmark has risen from trendline support, edging atop the 50-day moving average, currently 201.65.
More distant overhead matches the range top (207.50).
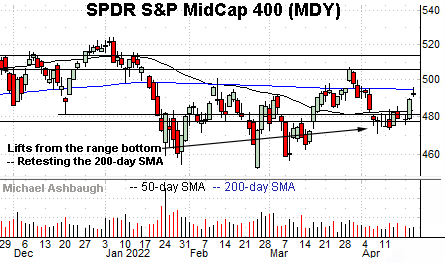
Meanwhile, the SPDR S&P MidCap 400 ETF has rallied from its range bottom.
The prevailing upturn places the 200-day moving average, currently 494.78, under siege.
Note the 200-day has effectively matched a three-month range top, a backdrop resembling that of the Dow industrials in some respects.
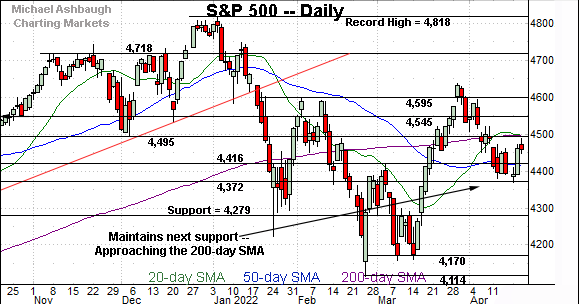
Returning to the S&P 500, the index has rattled the range on two key technical levels.
To start, the index has maintained major support (4,372), an area detailed repeatedly.
The week-to-date low — also the April low (4,370) — registered nearby.
More immediately, the prevailing upturn places major resistance (4,495) back in play, an area closely matching the 200-day moving average, currently 4,497.
This area marks a well-defined bull-bear inflection point and the pending retest will likely add color. Broadly speaking, the S&P 500’s bigger-picture bias remains bearish-leaning pending sustained follow-through atop the 4,495 area.
Watch List
Drilling down further, the iShares Latin America 40 ETF (ILF) is acting well technically.
The shares initially spiked four weeks ago, rising sharply amid surging commodity prices.
The subsequent pullback has been comparably flat, placing the shares near support (29.10) and 6.5% under the April peak.
Delving deeper, trendline support tracks the 50-day moving average, and is closely followed by the breakout point (27.75). A sustained posture atop this area signals a bullish bias.
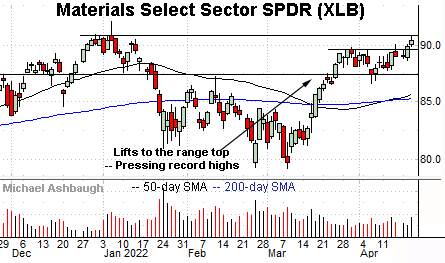
Moving to U.S. sectors, the Materials Select Sector SPDR (XLB) is showing signs of life. (Yield = 1.6%.)
More directly, the group is challenging all-time highs.
The prevailing upturn punctuates a tight one-month range — hinged to the steep March rally — laying the groundwork for potentially decisive follow-through. Tactically, a breakout attempt is in play barring a violation of the former range top (89.60).
(On a granular note, the week-to-date closing peak (90.55) has registered just six cents under the group’s record close (90.61).)
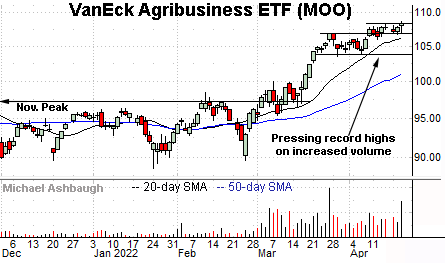
Looking elsewhere, the VanEck Agribusiness ETF (MOO) has taken flight, fueled by a sustained volume increase amid the prevailing geopolitical backdrop.
Amid the upturn, the group has asserted consecutive flag patterns, tight ranges hinged to the aggressive March breakout.
As always, the bull flag signals muted selling pressure — (even at higher prices) — improving the chances of upside follow-through.
Tactically, the 20-day moving average, currently 106.30, is followed by the former range bottom (103.75). A sustained posture higher signals a bullish bias.
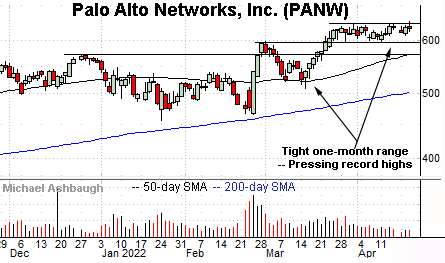
Moving to specific names, Palo Alto Networks, Inc. (PANW) is a well positioned large-cap cybersecurity name.
As illustrated, the shares have asserted a tight one-month range — a coiled spring — hinged to the comparably sharp February and March rallies.
Tactically, a breakout attempt is in play barring a violation of the prevailing range bottom (596.50). Delving deeper, the 50-day moving average has marked an inflection point and is rising toward support.
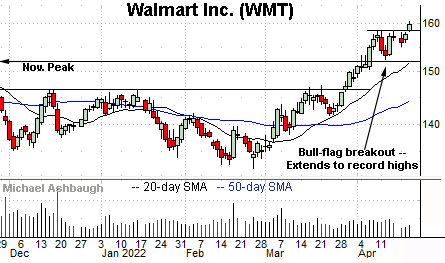
Finally, Walmart, Inc. (WMT) is a well positioned Dow 30 component. (Yield = 1.4%.)
As illustrated, the shares have tagged all-time highs, rising from an April flag-like pattern.
Tactically, the former range top (158.40) is followed by the firmer breakout point (152.00). The prevailing rally attempt is intact barring a violation.
More broadly, the shares are also well positioned on the five-year chart, rising from a massive double bottom defined by the 2021 and 2022 lows.


