S&P 500 rallies from major support (4,170) even as bigger-picture backdrop deteriorates
Focus: Second 7-to-1 down day, across just three sessions, raises caution flag
Technically speaking, the major U.S. benchmarks are vying to stabilize in the wake of a damaging four-session downdraft.
Against this backdrop, the S&P 500 has maintained major support (4,170) — at least for now — and the quality of its rally attempt will likely add color.
Editor’s Note: As always, updates can be directly accessed at https://chartingmarkets.substack.com.
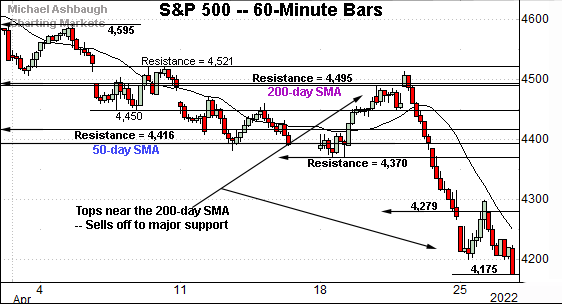
Before detailing the U.S. markets’ wider view, the S&P 500’s hourly chart highlights the past four weeks.
As illustrated, the S&P has extended its downdraft, plunging as much as 338 points, or 7.5%, from last week’s high.
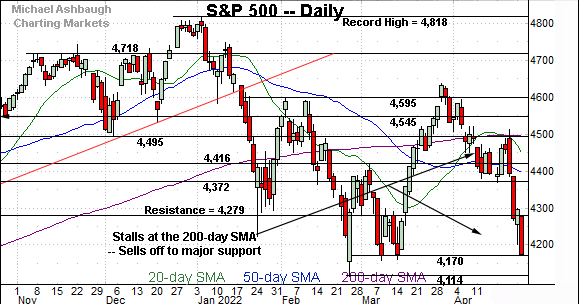
The downturn has been underpinned by major support (4,170), an area better illustrated on the daily chart.
Slightly more broadly, the downturn punctuates a failed test of major resistance (4,495) matching the 200-day moving average, currently 4,494.
Similarly, the Dow Jones Industrial Average is digesting an agressive downdraft.
In its case, the index has dropped as much as 2,261 points, or 6.4%, across just four sessions.
Moreover, the initial rally attempt has stalled near resistance (34,102), an area detailed previously.
The week-to-date peak (34,106) has registered nearby amid a failed retest. Bearish price action.
True to recent form, the Nasdaq Composite remains the weakest benchmark.
The index has plunged as much as 1,220 points, or 8.9%, from last week’s high, tagging its lowest level since March 2021.
Recall the downturn originates from major resistance (13,682), detailed repeatedly.
Also recall the S&P 500 and Nasdaq Composite have concurrrently sold off from key inflection points — around S&P 4,495 and Nasdaq 13,680. Bearish price action.
Widening the view to six months adds perspective.
On this wider view, the Nasdaq has placed distance under its 50-day moving average, tagging 13-month lows.
Tactically, the former range bottom (12,555) remains an inflection point.
More broadly, the Nasdaq’s former breakdown point (13,350) marks more distant resistance. A swift reversal atop this area — which does not currently look likely — would mark a step toward stabilization.
Looking elsewhere, the Dow Jones Industrial Average has tagged one-month lows, extending a downdraft from the April peak.
Tactically, the 50-day moving average, currently 34,171, is descending toward resistance — the 34,100 area — better illustrated on the hourly chart. Follow-through atop this area would place the brakes on bearish momentum.
Conversely, near-term support, around 33,130, is followed by the March closing low (32,632) and the year-to-date low (32,272).
Meanwhile, the S&P 500 has plunged to a headline test.
Recall major support (4,170) matches the year-to-date closing low, the level from which the massive March rally originated.
The week-to-date closing low (4,175) has roughly matched support to punctuate a six-week round-trip back to the range bottom. (Monday’s review detailed this area as a potential floor.)
(On a granular note, Tuesday’s session high (4,278) matched familiar resistance (4,279) an area detailed repeatedly.)
The bigger picture
As detailed above, the bigger-picture technicals remain bearish amid persistent, and broadly-based, April selling pressure.
On a headline basis, the Nasdaq Composite has tagged 13-month lows, while the S&P 500 is vying to rally from major support (4,170).
Against this backdrop, a corrective bounce is due — and seems to be underway — though the more important bigger-picture trends continue to point lower. Note the worst six months seasonally — May through October — are set to begin next week.
Moving to the small-caps, the iShares Russell 2000 ETF is pressing its range bottom.
In fact, the small-cap benchmark has tagged a nominal 16-month low, its lowest level since December 2020.
Amid the downturn, an extended test of major support — 187.90-to-188.10 area — remains underway.
An eventual violation of support opens the path to a less-charted patch — illustrated on the five-year chart — and potentially material downside follow-through. The monthly close will likely add color.
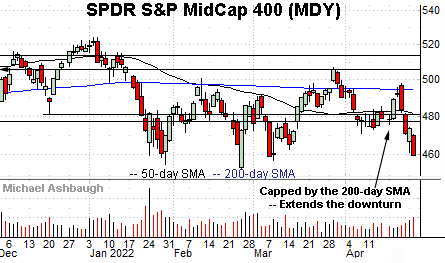
Meanwhile, the SPDR S&P MidCap 400 ETF has extended its pullback from the April peak.
The prevailing downturn originates near the 200-day moving average, an area roughly defining its three-month range top. As always, the 200-day is a widely-tracked longer-term trending indicator.
Market breadth continues to press bearish extremes
Moving to market breadth, the prevailing downturn remains a bit ominous internally.
For instance, the NYSE has registered two 7-to-1 down days across a narrow three-session span. (Declining volume surpassed advancing volume by a 7-to-1 margin.)
The aggressive downturns registered Friday and Tuesday, amid selling pressure that otherwise inflicted broady-based damage.
As always, in a textbook world, two 9-to-1 down days — across about a seven-session window — reliably signals a major trend shift.
So the prevailing downdraft remains not quite textbook bearish, but it’s close, and marks unsually aggressive selling pressure in the post-pandemic market context.
Returning to the S&P 500, this next chart is a weekly view, spanning 30 months. Each bar on the chart represents one week.
As illustrated, the S&P has pulled in to major support (4,170), detailed previously.
The prevailing downturn punctuates a developing head-and-shoulders top, defined by the September, January and March peaks.
As always, the head-and-shoulders top is a high-reliability bearish reversal pattern.
Tactically, a downside target projects to the 3,800 area on a violation of the range bottom. (Start with 4,545 - 4,170 = 375 points. Then, subtract the result from the breakdown point: 4,170 - 375 = 3,795.)
So the S&P’s response to support — across the next several sessions — will be worth tracking.
(Also see Monday’s review for added detail regarding the range top (4,545).)
Returning to the six-month view, the S&P 500 has staged an aggressive four-session downdraft. Recall the downturn has encompassed two 7-to-1 down days across just three sessions.
Separately, the pullback originates from major resistance (4,495) a headline inflection point, detailed repeatedly.
Against this backdrop, the S&P 500 remains near-term extended, and is due a corrective bounce.
The quality of its rally from major support (4,170) — as measured by volume, breadth and the response to technical levels — will likely add color.
Tactically, a swift reversal atop major resistance (4,279) would mark a step toward stabilization. (Tuesday’s session high (4,278) matched resistance.)
Beyond near-term issues, the S&P 500’s longer-term trends remain bearish, based on today’s backdrop. Friday’s close marks both a weekly and monthly close — as well as the beginning of the worst six months seasonally — and will likely add color.


